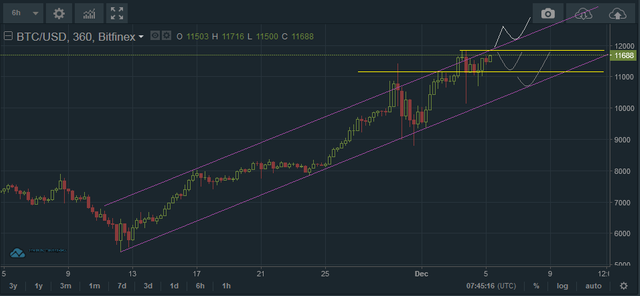
05.12.2017: Actual development of BTC/USD (stock BitFinex)

Chart H6
Yesterday, on the basis of CandleSticks Formation Evening Star in the chart H6, I predicted decline, which indeed came, although it was not as massive, nor it did not reach the height of formation and the stock started to become stronger again. The desire of the stock to rise up is strong.
What should we be aware of today: Importat resistance is level of ATH 11874$ and TL tendency of the channel. Breakthrough over these levels would be a sign to boost over 12k with a maximum target of 12300$. Important support is level around 11150$ and of course overall support of TL tendency of the channel.
On the market there is also an opportunity for creation of price formation Double Top as in the chart H6, which is but too soon to be evaluated..
Market cap BTC enforced by 12,2 bill$ to 197 billions of dollars.. (24hours)
This analysis is only orientational and does not serve as a recommendation to purchase or sale..Invest only as much as you can afford and as much as it doe not threaten your breadline. Respect basic rules for minimalisation of risks connected with purchasing on the stock market, hence minimally StopLoss.
Source of the chart: Bitfinex
Author of analysis: IXOYE..