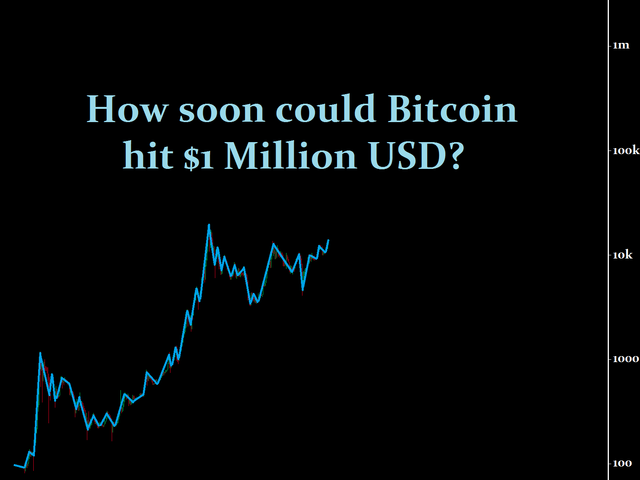
This chart shows when 1 Bitcoin could be 1 Million Dollars
It's time for an update to a chart calculation I've been doing since 2013: When might Bitcoin's price reach the one million dollar mark?

In 2013 when I said Bitcoin was going to $1000 and beyond, my YouTube viewers laughed at me, unsubscribed, and/or left dismissive comments. It happened, and exactly when I said it would happen, too. From that point on, I've made dozens of bizarrely-accurate calls - and essentially no lemons. I was the first person I know of to use a long-term logarithmic chart to identify the repeating bowl and breakout pattern that is now becoming widely recognized. It has been one of my primary tools to make my flawless string of predictions, and I've documented it all openly here on the blockchain for anyone to see. Here's my latest rough calculation with updated data to Oct 30 2020.

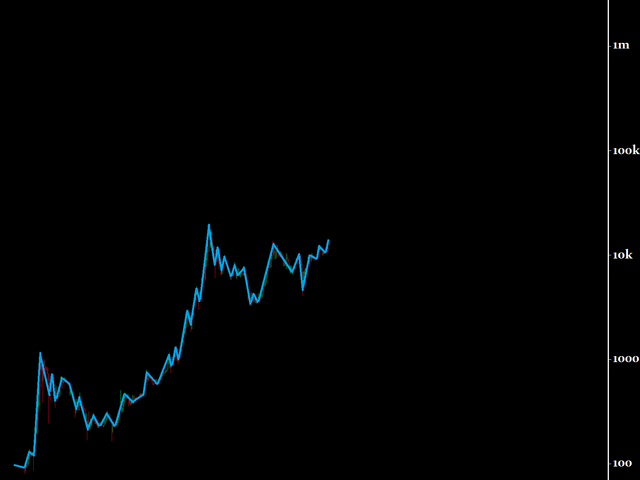
This is a 7 year chart of BTC, priced in USD on the logarithmic scale. It shows percentage moves rather than nominal dollar moves, helping us gauge trends over long time periods and large value fluctuations.
You'll notice I've used a blue brush to paint a "summary" of the price action for extra clarity. Today we're at the very right-hand point, at $13500 USD.
One way to find out where the price might go next, is to follow the trend of where it has been. Since BTC, while notoriously volatile, has indeed followed a recognizable overall trend, we can use that to estimate what another few years may bring.
Of course, there's no guarantee that what happened in the past will repeat verbatim. In fact, it's almost guaranteed not to. This is only one potential way to ESTIMATE what might be coming, knowing just because it has worked for several years doesn't mean it will always.
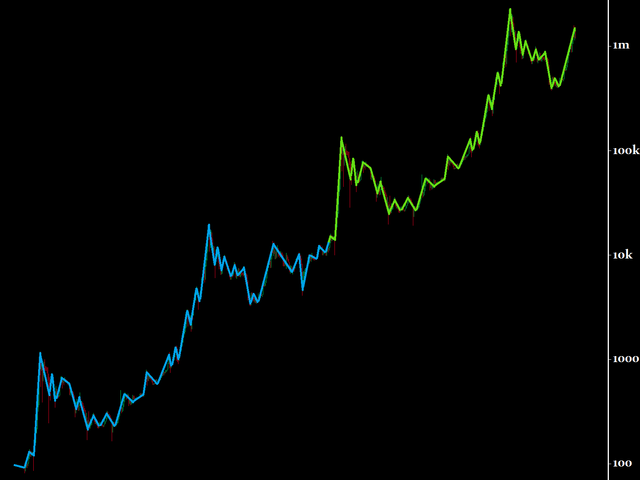
Here's what happens if you copy the corresponding 4 year section from the chart, and attach it to today, continuing the long term trend:

You'll notice that this doesn't assume there will be a nonstop climb from here to one million - there will continue to be massive volatility and even bear markets. That has always been the case.
It does appear well within the realm of possibility for Bitcoin to breach $1million USD before the end of 2024.
Please note that this isn't necessarily a prediction, just a calculation, one I've used in the past with great results. If you want my latest thoughts on price action, click here for a short video, which links to my most recent actual prediction - a 2.5 year old video that covered everything up to the end of 2020. It has been perfect thus far and I have no reason to revise it.
That note aside, yes, the path marked in lime green could very well be what is (approximately) coming. I do expect a test of $20000 before the year's out, and a new high soon thereafter, then some sort of bear market, before another bull move to the 6 or 7 digits. I have said since 2013 that this was a distinct possibility for Bitcoin, and that possibility seems even larger now than back at $70.

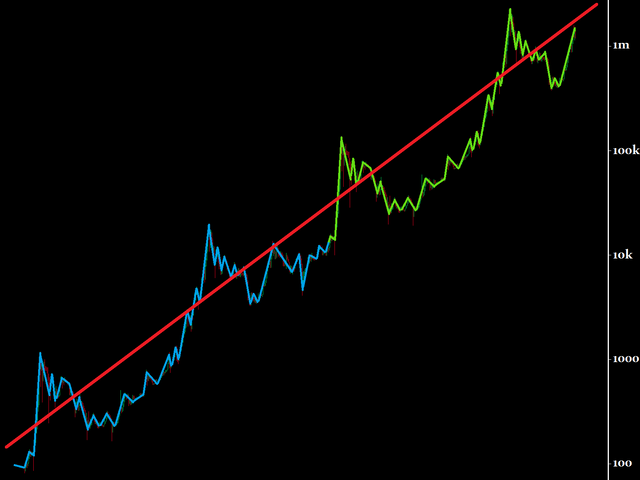
The best average trend line (in red) oversimplifies a complex chart, but still makes a clear point:
If the overall trend continues, the question isn't if Bitcoin will hit a million dollars, it's a question of when.
And one potential answer is: approximately 2024.
DRutter

Great post Drutter!