BTC Update: 2-3-18
Price: ~$8,800
24HR:
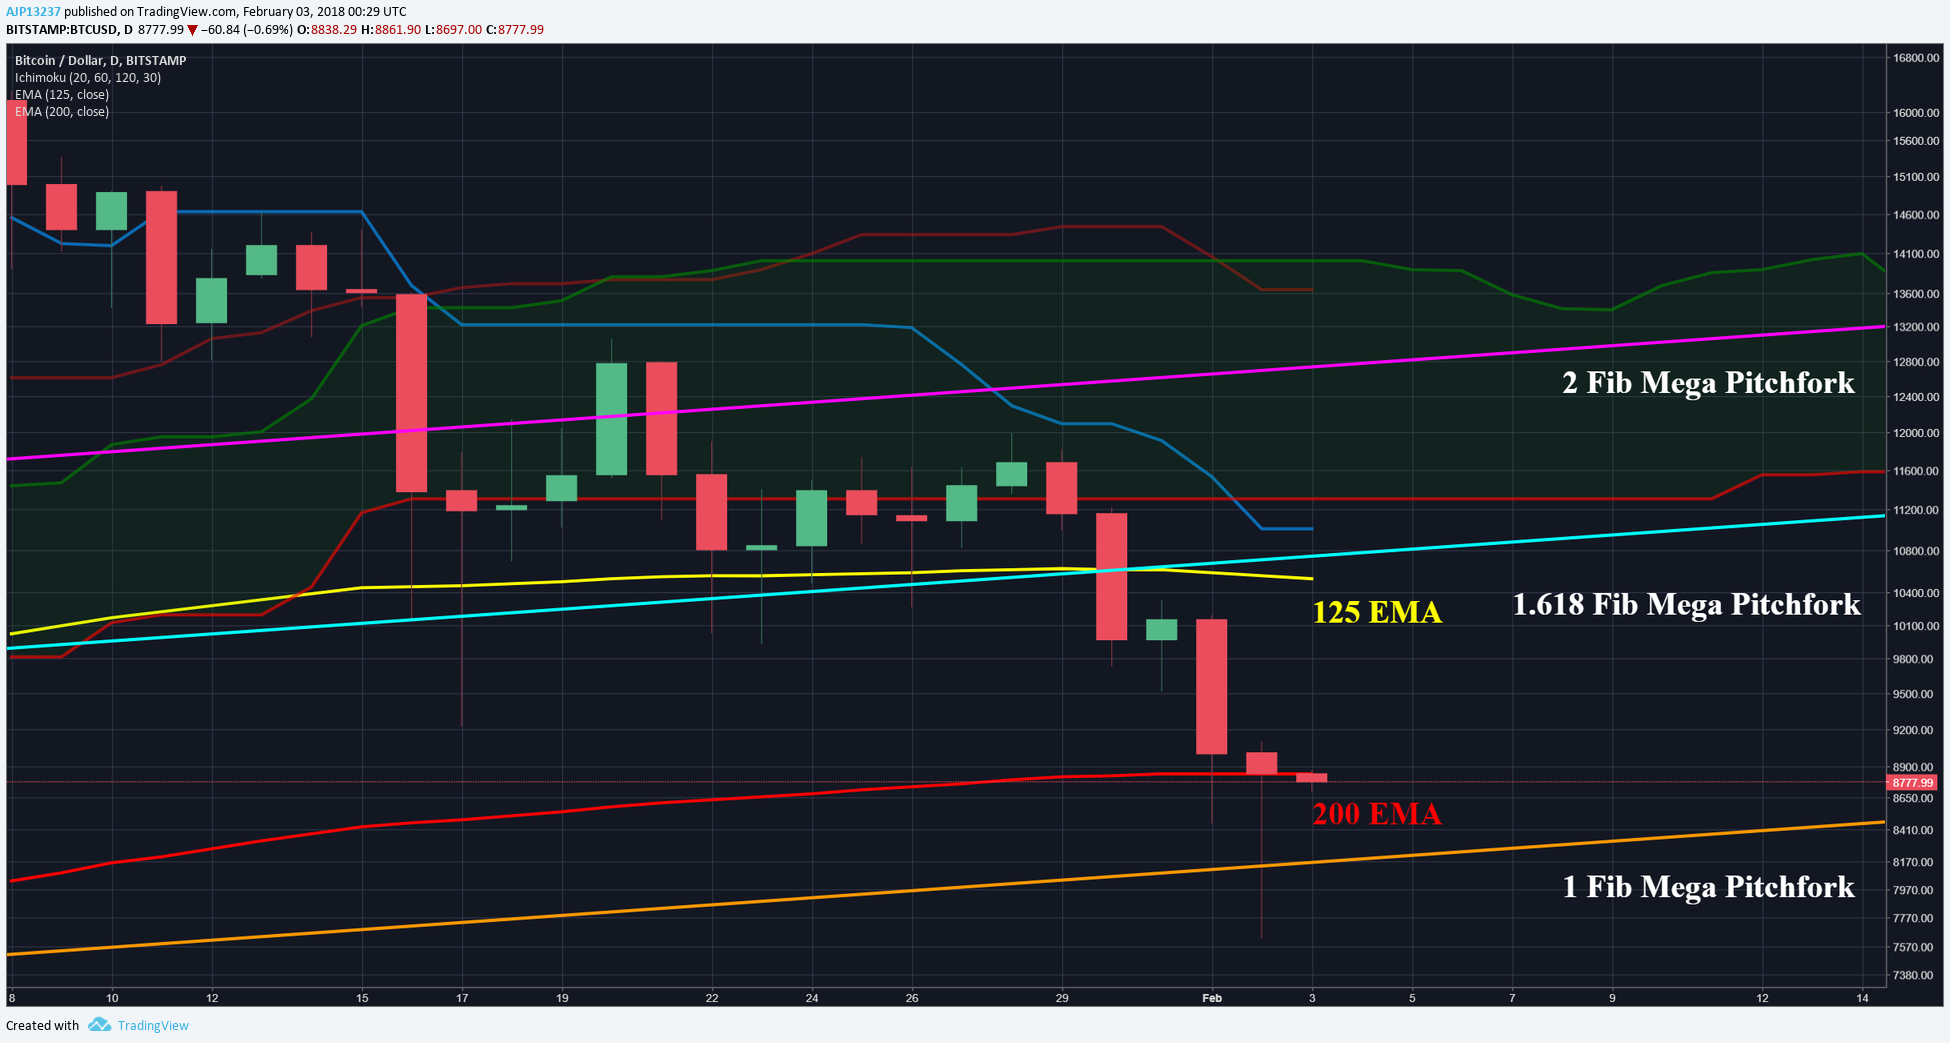
Yesterday BTC was able to close above the 200 EMA; however the support eventually sunk & needed a trip to the 1 Fib. Today price managed to wick itself back up to the 200 EMA & closed just on it. While the bounce looks strong, because the 200 EMA was broken it will at least offer some resistance before concurring it fully, and a retest of the 1 Fib is not out of question for an attempted double bottom.

6HR:
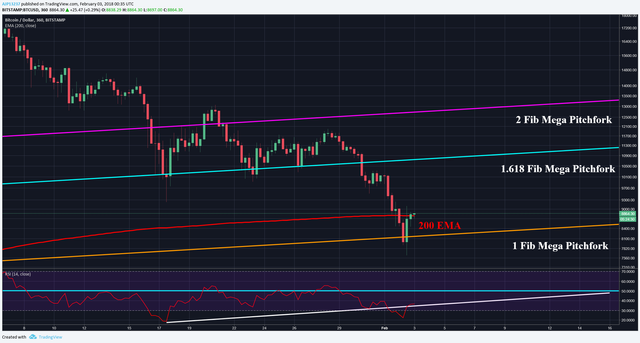
In the last update I said to keep an eye on a mini RSI trend developing. The trend did break down, however is attempting to bounce back in & did manage to create a higher lower than before, creating a divergence in price & RSI. This divergence is an indicator that despite price action going down, the strength in these price levels is growing, a good sign for bulls. If RSI is able to break back in trend, 50 RSI level will still offer resistance & breaking out can’t happen till overcome.

1HR:
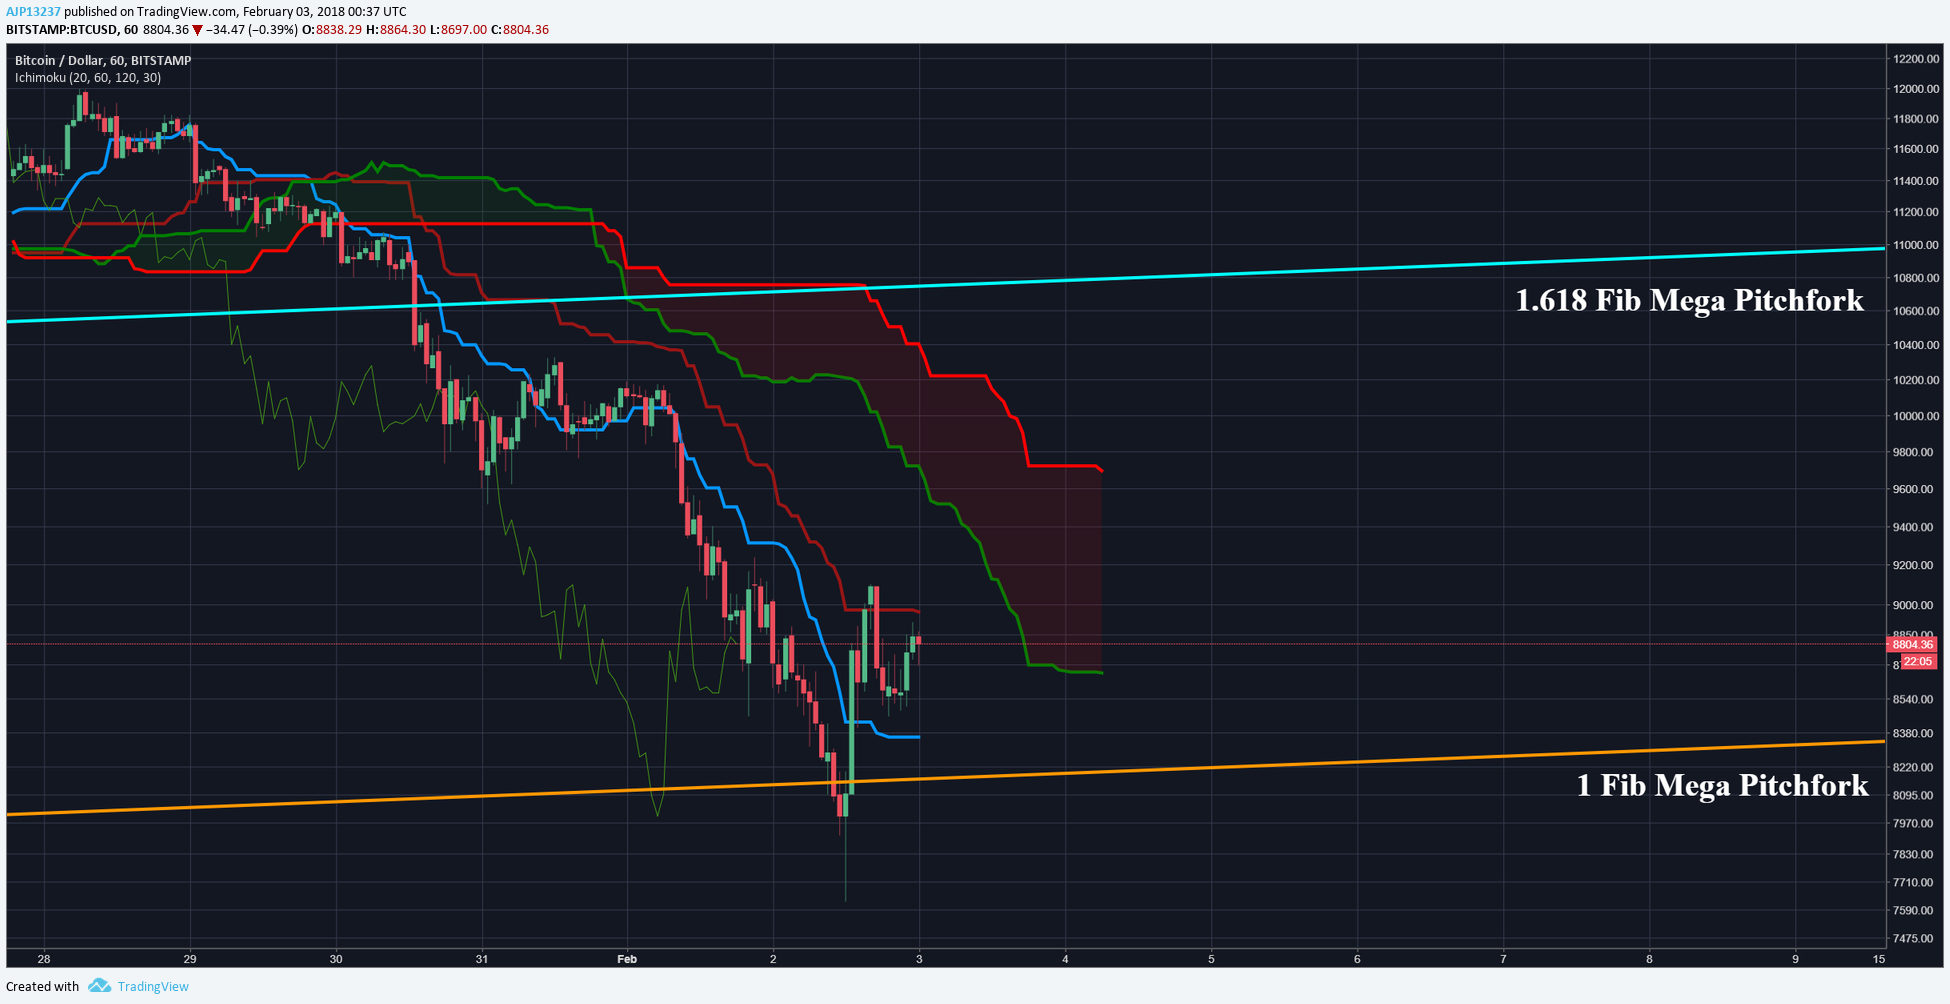
After finding support on the 1 Fib, price was able to shoot back up to the Kijun before encountering some resistance. Currently price is ranging between the Tenkan & Kijun and could spell some sideways action for next (24-48hrs) until it runs into the bearish cloud cover ahead. At this point, price will have to make a strong move into the cloud or run risk of faltering back to 1 Fib.

Mega Pitchfork:
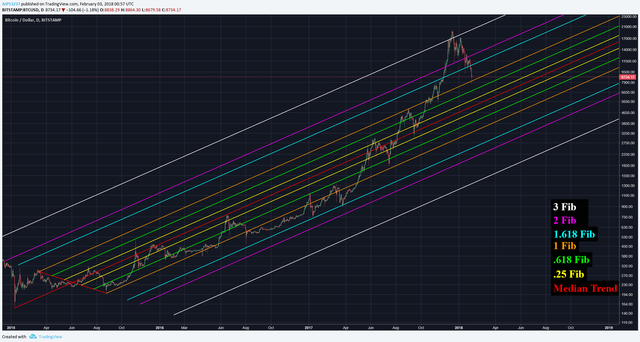
I realize I’ve talked at length about the Mega Pitchfork however haven’t shown an update of it in its entirety in a while. The Mega Pitchfork spans since the inception of the 2015 Bull Run & has been a reliable source for macro supports & resistances. Price continually likes to ping between these support & resistance levels and while it’s not always entirely clean, it does a damn good job & it’s rare that price is able to break through resistance or support long before needing to revert to the other side. I encourage you to study the price action along these support & resistances to exemplify their importance. If at any point you find these charts too small to read or want to zoom in, simply right click on the chart & open in new tab for full view.

Prognosis:
BTC managed to have a strong bounce along the 1 Fib of the Mega Pitchfork & is currently meandering around the 200 EMA. The longer price stalls around the 200 EMA, the more likely a retest ranging between the local bottom ($7.6K) & the 1 Fib ($8.2K) becomes. The quicker price can get past the 200 EMA & begin taking out resistances the stronger chance that bulls are back.
If you found this useful & educational, please like, share, & follow.
steemit: @ dogevader
twitter: @ Noob_Charts
Finally, if you have any questions or comments, leave them below & happy trading!
Thanks for your post and great analysis