Bitcoin price decline puts on pause before resetting
The reduction in the price of bitcoin takes a pause. The market is struggling to adjust the price up that portends the next wave of decline.
Analysis time: 23.07.2016, 14:00 UTC
Bitstamp, the 1-hour chart.
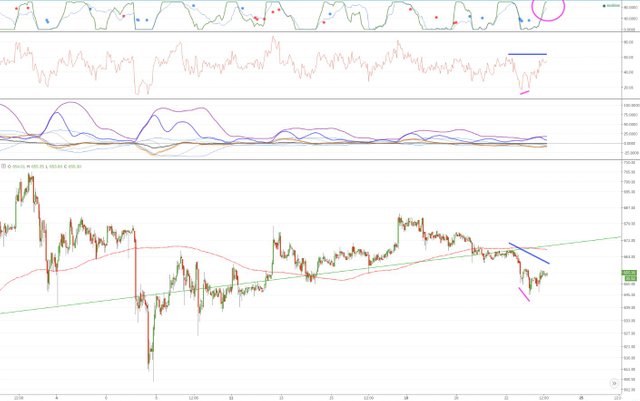
As expected, after yesterday's signal to the xbt.social, the price has dropped. During the night the correction has pushed the price back up. As shown by crimson lines, very clear divergence was accompanied by a price reversal, when price made a lower low, and at the same time the RSI made a higher high.
Taking into account the fact that the 4-hour chart is quite clearly bearish, where at the same time MACD is below zero and signal lines, as well as the fact that the 1-hour chart on the verge of entry in exactly the same terms, we may wonder: What's next?
Based on a bearish 15-minute, 1-hour and 4-hour charts, it is possible to give an unequivocal answer: the decline will continue.
Notice how the 1 hour chart (above) stochastics (top graph, circled in Magenta circle) back to the maximum, and almost at the same time the RSI forms a reverse divergence to the previous maximum. This means that as soon as the price will grow enough that they reached the high, the RSI will be in a significant divergence (highlighted in blue) and from a technical point of view begins with the sale.
The next question that you can ask the traders: What is the distance of reduction can I expect?
In this respect there are two scenarios:
1. Big reduction to $600 or $560, in accordance with the overlapping goals of expanding Fibonacci with support and resistance at these levels. Or
2. The final subway to reduce to the level of consolidation at $640 (Bitstamp), which will be followed by a reversal up, which will grow into a new rally.
The second scenario is based on the typical behavior of prices of bitcoin, when technical indicators become purely bearish just before a rebound. This script will appear a sharp decline, which over the next few hours leveled with clear green candles. The bottom line for RSI divergence at the low, soon to be followed by a buy signal from MACD.
Summary
Bitcoin price is adjusted before the wave of decline. Sale can be quite serious and to show a return to levels of $600 (or $560 - the low of the previous decline), or it may be short and sharp, up to $640 on Bitstamp. The first scenario, perhaps, would be more preferable, since the market has sold us to the obvious support, which then started a new growth with a solid Foundation. When the markets are slow with a significant correction, as a rule, this leads to protracted periods of grueling uncertain consolidation. Let's see which option will choose the market.

"We have elected to put our money and faith in a mathematical framework that is free of politics and human error." - Tyler Winklevoss