Bitcoin (BTC): Price Analysis (Tue, 24-Apr-2018)
For education.
Price (broken through resistance)
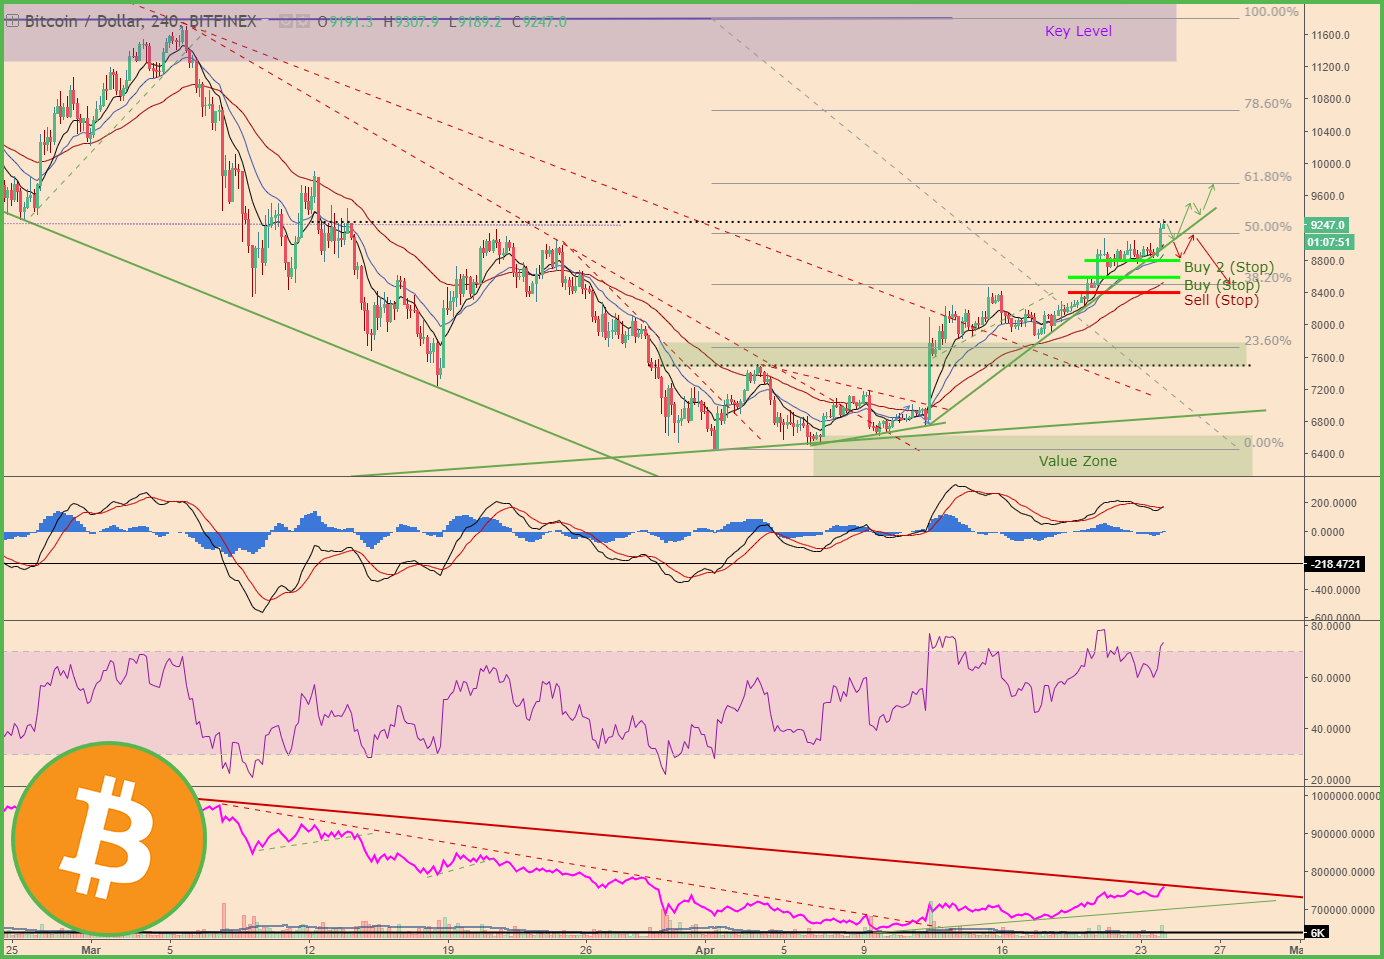
Following on from yesterday's review (here) BTC broke through the price resistance at the $9,000 level and is currently trading at $9,200.

This recent move strengthens the up trend currently in play, however, don't expect a northwards move in a straight line, as there is historical resistance between here and the $10,000 level.
Indicator check (convergence)
Yesterday we noted possible divergence on the MACD which appeared to be sign for weakening of the trend, however that turned out to be just a reaction to the price resistance at $9,000.
Volume (muted, OBV nearing resistance)
The trading volume (bitfinex) remains low, however, the On Balance Volume (OBV) indicator appears to be approaching resistance from a descending trendline. Being a derived indicator is is difficult to judge whether this represents actual psychological resistance however. We'll have to wait and see.
Trading strategy (expecting a pullback, move stop)
The two open trades in play can now move their stop to $8,800, as this level is now technically protected by the price consolidation. Of course this risks being stopped out early but locks in profit and a breakeven trade.
This is acceptable as if the price breaks below this level, the trend will be questionable.
Until tomorrow,
Bobby
(Trader)