Bitcoin (BTC): Daily Price Action (Fri, 13-Apr-2018)
For education purposes only.
Price (upside pop)
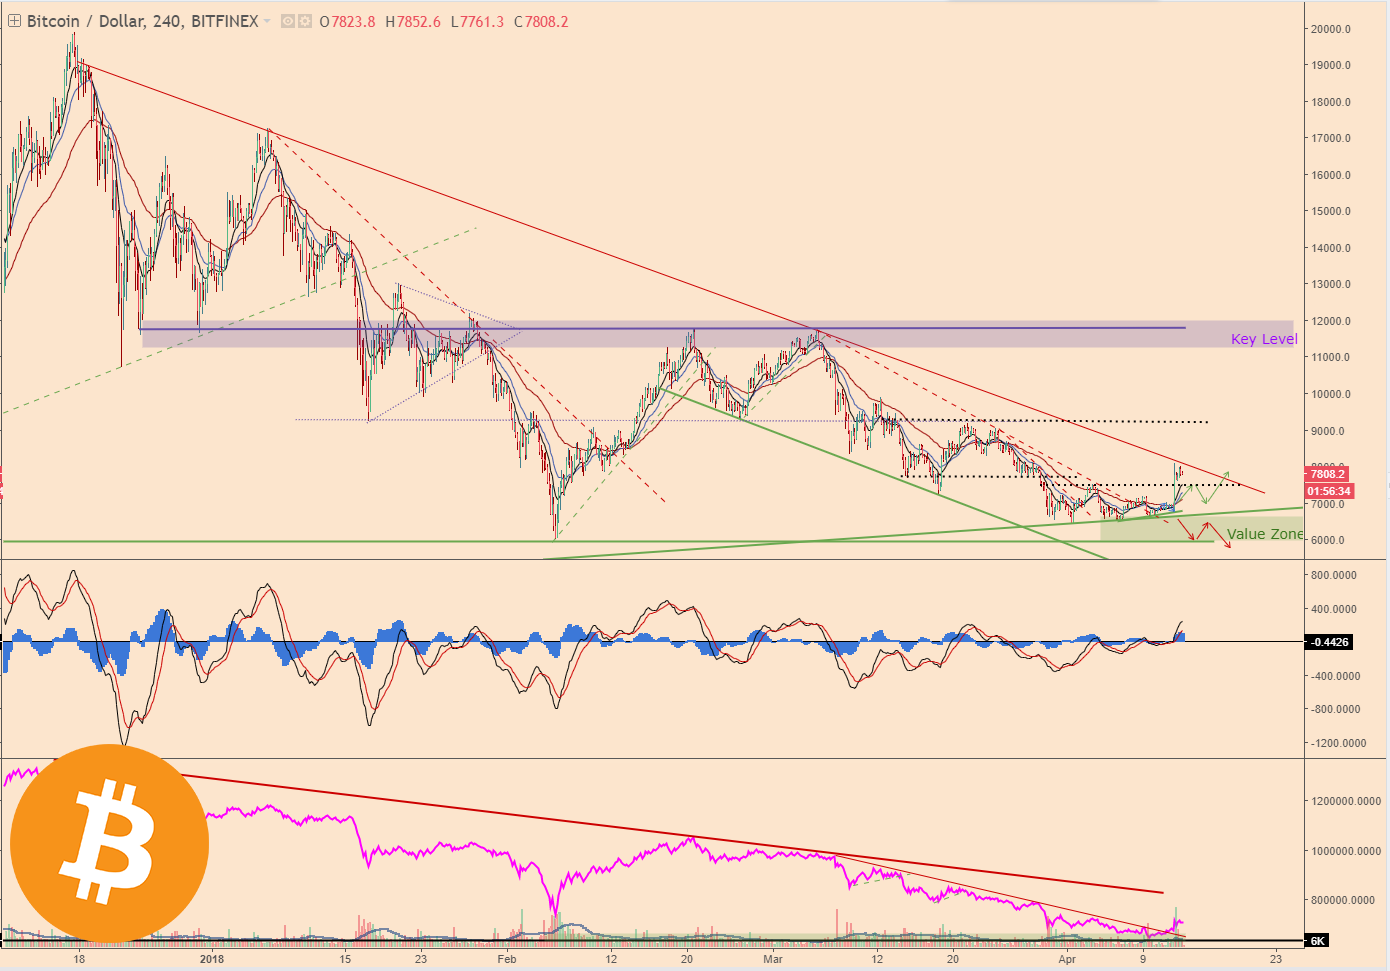
Following on from yesterday's review (here), we were expecting an imminent return of volatility following the obvious price squeeze and we certainly got it:

The BTC price traded from $6,800 to a high of $8,000 in one 4hr candle: a fairly rapid move.
Following this move, BTC is now overextended as it encounters resistance from the longer-term descending trendline (red), but this price action potentially signals the reversal.
I am now looking for a pullback perhaps to around the $7,200 level, a consolidation pattern, break back to the upside then I'd be looking to go long.
Volume (high spike)
The price move coincided with a very healthy looking volume spike.
This has finally broken the descending trendline line we were watching on the On-Balance-Volume indicator, which indicates (if it wasn't evident enough from the price charts) a return of the buyers.
Trade Strategy (Long, following pullback and consolidation)
As mentioned we're looking for the price to pullback (relax), form a price consolidation pattern around the $7,200 area and then looking for a long entry break. Of course we may not get the chance, but I think the resistance level at $8,000 presents a probability for this scenario.
Until tomorrow,
Bobby
(trader)