$1700 for BTC already very soon! Elliott Wave Analysis
All the talks about certain news influencing market moves are just talks, they do not have any grounds. The market moves on its own, it is moved by the crowd. News serves as a catalyst for a move to start, but it does not determine the direction of it, and this is confirmed by the fact that the same events often influence the market in different ways, or absolutely differently from what should be expected. Now we’ll look into it using the example of Bitcoin! And will see the possible course of events as well .
The price of a commodity in the virtual market is determined by the demand and offer balance, that is, how many people are ready to buy how much of the commodity right now, and how many people are ready to sell how much of the commodity.
There is a common opinion that market moves are rational:
the higher the demand is —> the higher the offer is —> the price grows.
(law of supply and demand - https://en.wikipedia.org/wiki/Supply_and_demand)
But this means that the price for a trade instrument has to grow incessantly and without any stops, starting with the moment when the first buyers show up, and so on, and on, and on. But this is not so, is it? So, what is the reason?
The market is irrational and limited:
the higher the demand is —> the lower the offer is —> the price grows.
There is always a finite number of buyers and sellers in it, and what is more, each of them has their own anxiety level, which can induce them to close a trade prematurely. There are large speculators playing in the market who prefer making transactions over large time intervals and with large amounts of money, and smaller speculators who make transactions every day but their number is much larger. The distribution between these groups doesn’t have a distinct borderline. It is important to understand that there are people who trade within different time intervals, and different amounts of losses are critical for them and inducing to close transactions prematurely.
So, what moves the market? The market is moved by the behavior of the crowd in the interaction between groups of buyers and sellers with different anxiety levels and different financial possibilities.
Let’s distinguish and group the conditions for changes in the price of any financial instrument under the conditions of an ascending trend. So, the buyers are buying, the sellers are selling, the market is going up. Why will it reverse?
The price grows as long as there are buyers. The market is limited, and this means the number of buyers can end. If there are no more people who would buy at the current moment of time, a reversal of the ascending trend happens.
The price grows if there is someone who would sell. If there are no more sellers who are ready to sell the instrument right now, the price reverses.
When all the sellers who could enter a trade in the time frame concerned have already done that — and there are no more people who would sell, the demand/offer balance shifts, and the ascending trend of the market reversals
We have no information about the number of buyers and sellers at every moment of time, about the time frame they trade in, how liable to panic they are, and what financial possibilities they have – we do not know any of these things. But we can, on the basis of general considerations, plot the chart of sum of oscillations with various frequency and find regularities in it, which would be similar for the real world as well.
The picture shows the chart of the following function:
y= x/12 + 2sin(x/4) + sin(x) + 0.5sin(4x) + 0.25*sin(12x) – that is, the sum of oscillations with various frequency. The chart represents the common behavior of price rates in any market. Of course it does not seem possible to find any describing function for the real market, but we are using a simplified model — the sum of four oscillating processes (figuratively speaking, the four sentiments of the investors trading in various time frames).
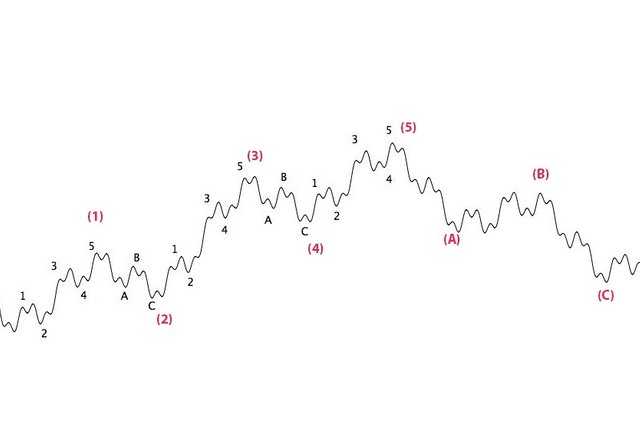
The regularities here are the following: the oscillations are patterns, that is, they have the same structure: 5 waves with the trend and 3 waves against the trend. The impulses (waves 1, 3, 5) are divided by corrections (A, B, C). The oscillations are interleaved in the different time frames, and the waves are in the golden ratio (the Fibonacci sequence). Any chart of absolutely any market can be split into oscillation patterns, starting with minute charts and ending with seminal ones, — the 5+3 structure can be traced everywhere, absolutely everywhere, and each wave can be split into 5 waves and 3 corrections again, and this is true from the most global levels of price movement up to minute charts.
These regularities were noticed and written down at the beginning of the 20th century by an American accountant named Ralph Nelson Elliott. He analyzed lots of charts and indexes thoroughly, and formulated the norms and rules of market movements. These norms and rules give the fullest picture of market movements, and allow for finding approximate levels of price reversals that will be reached long before that happens. This is done by way of analyzing all the previous oscillations and making calculations using the Fibonacci ratios. Elliott Wave Analysis works fine if all the previous structure of oscillations is marked correctly, and doesn’t work at all if there are any errors.
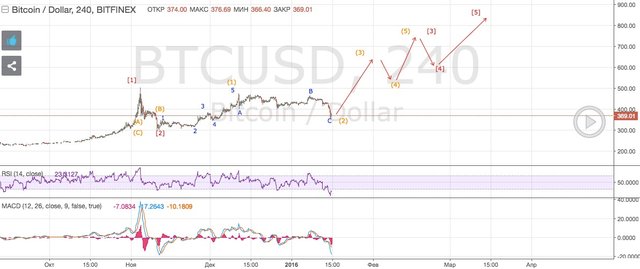
And now, the analysis. First, the old one, I made it in January and haven’t corrected it since then. As you can see, we didn’t make it to the goal by only $20. An accurate forecast 6 months BEFORE, isn’t it?
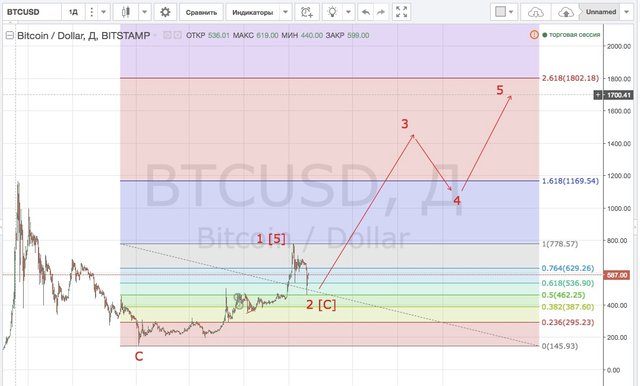
Over the last weeks we have seen the chain of A and B corrections, and probably the C wave. If the C wave has reached its completion, then the next goal for Bitcoin is $1700 per coin. I cannot name the time frames, perhaps we’ll dangle around for several months more, or perhaps a rapid growth will start already tomorrow.
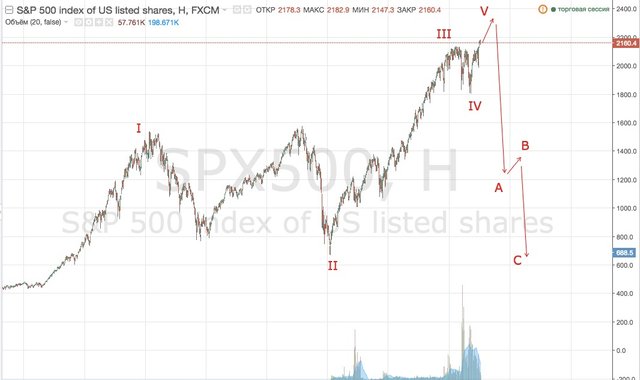
And now, for a special treat, this is the S&P500 chart for the next few years (it’s the index of 500 largest American companies). Can you imagine what it means? ;-) Will down, but not now. The basis of this behavior is the life line of information systems and sociodynamics.
Thanks for attention. Next publication will about the life line informational systems.
Thank you for your post! It's really interesting!
Ждем, ждем 1700 за биток ))
Great post. I think I might be starting to understand markets.
we hope so :-)
Wow, BTC surpassed your prediction. Wave 5 will be soon.