Bitcoin BTC smaller correction before goal, then larger correction.
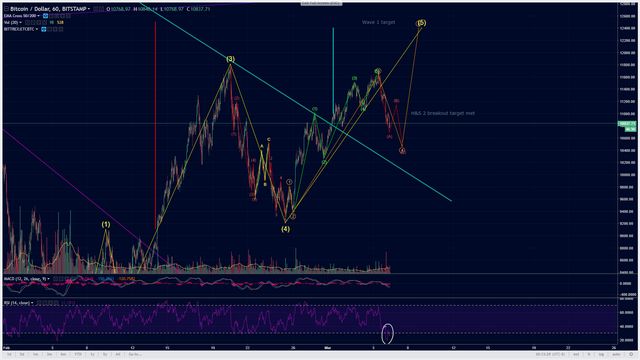
Updated wave counts support the current ABC correction that would be in place for wave 4. I know this is not exactly as some other analysts have shown, but that is precisely why you are reading this too.
There is tons of support at $10,440 as the fibonacci retracement from the primary impulse wave, as well as the current wave aligning around here. It follows then, that I don't place wave 4 touching the green line, though that would also offer support and would not invalidate the wave count.
The RSI is showing this as oversold, thanks to the recent sell-off volume.
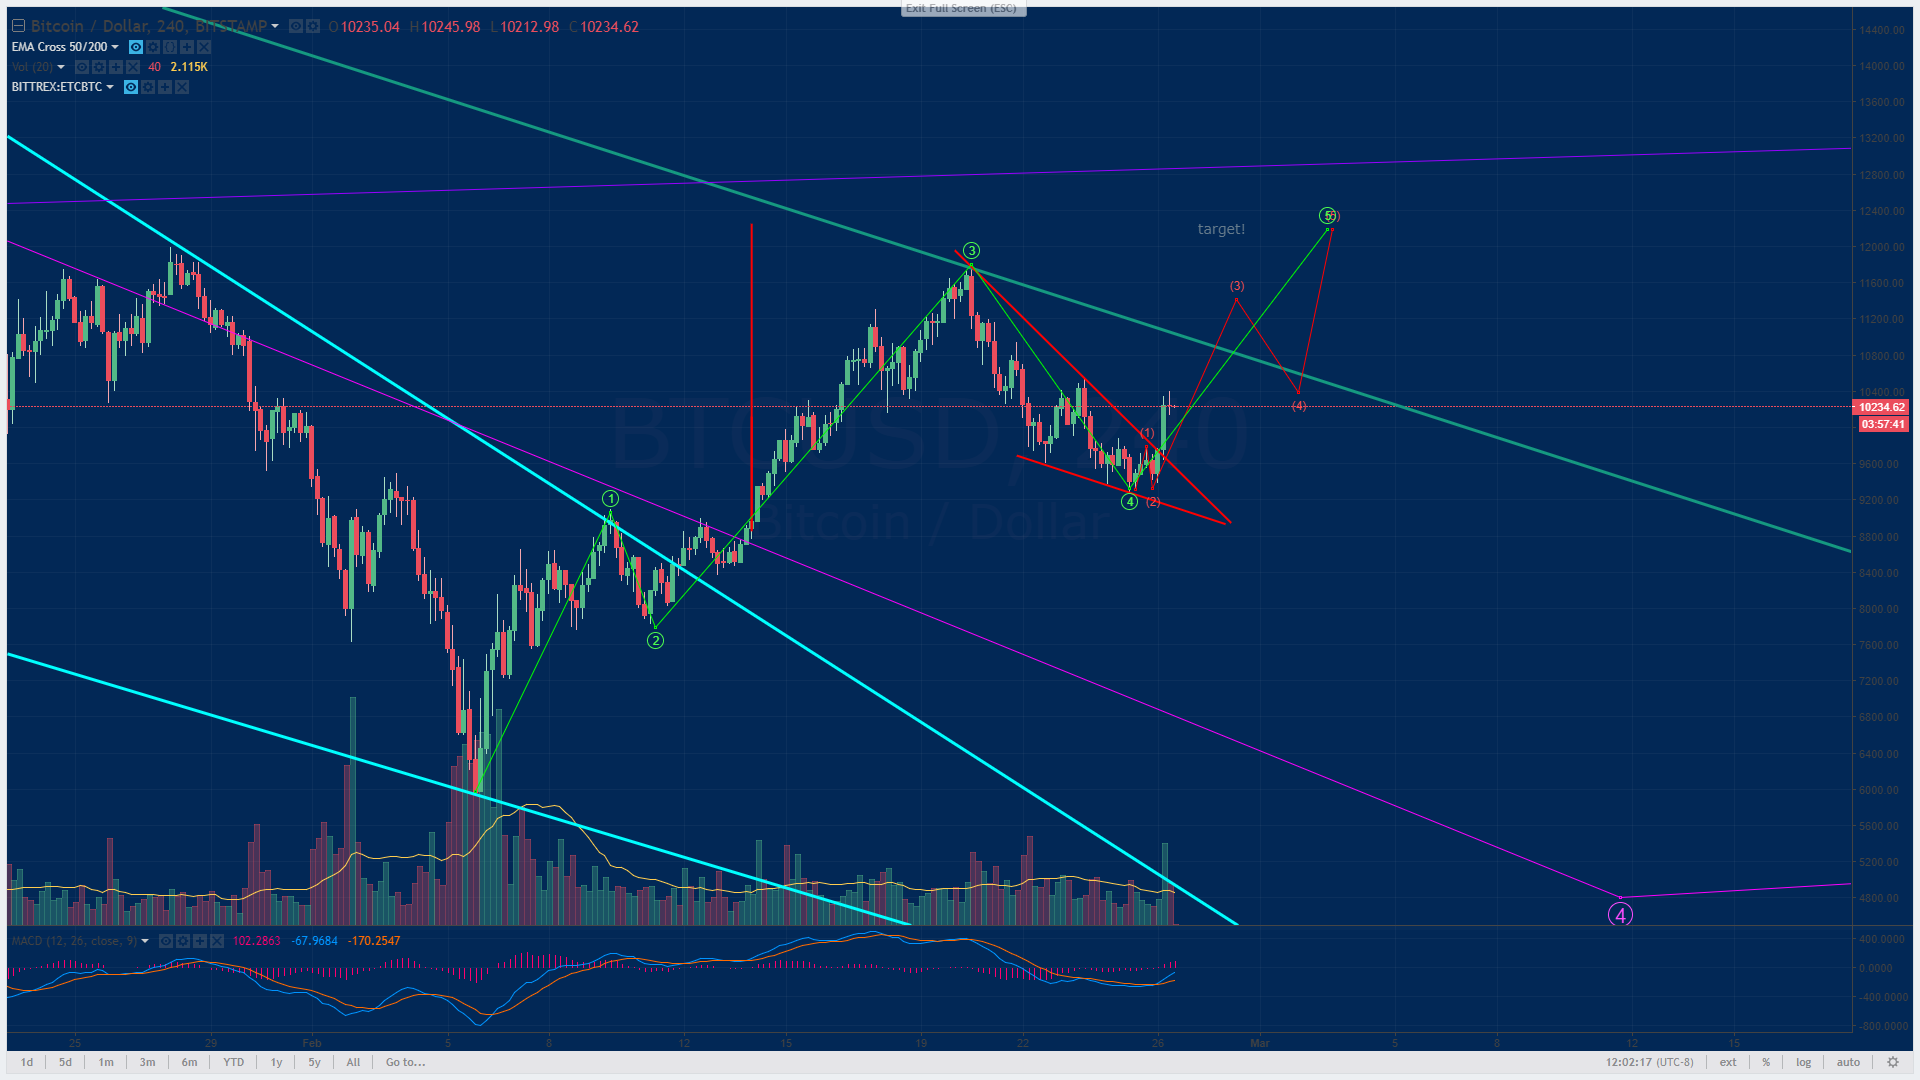
While the wave patterns continue to evolve, all signs look good to continue the trend of the originally charted pattern I posted 8 days ago:
The thing to look out for is a stronger 5th beyond my H&S targets as everyone finally gets excited about some higher highs!
Healthy trading and profitable investments,
The Freedom to Be
Legal Disclaimer: The information provided herein is for informational, or entertainment purposes only. I am not providing financial or investment advice of any kind. One should consult with a financial or investment professional to determine what may be best for your individual needs, and only invest what you are willing to lose.

If you profit from this idea and would like to keep the charts coming, wallets are below:
BTC: 13mG7EsCBB3wK2pQnV4zXqXUXmnVtCbmS6
LTC: LTfKUD4g4zytwbLFsFCJyG6N55xu3mtZYJ
ETH: 0x800fe4a5a75af9034f4982c04bdd4b557dca0f3f
BCC/BCH: 1QmchfEizCkLLweNySkAJmBCJ6zEtfkBB
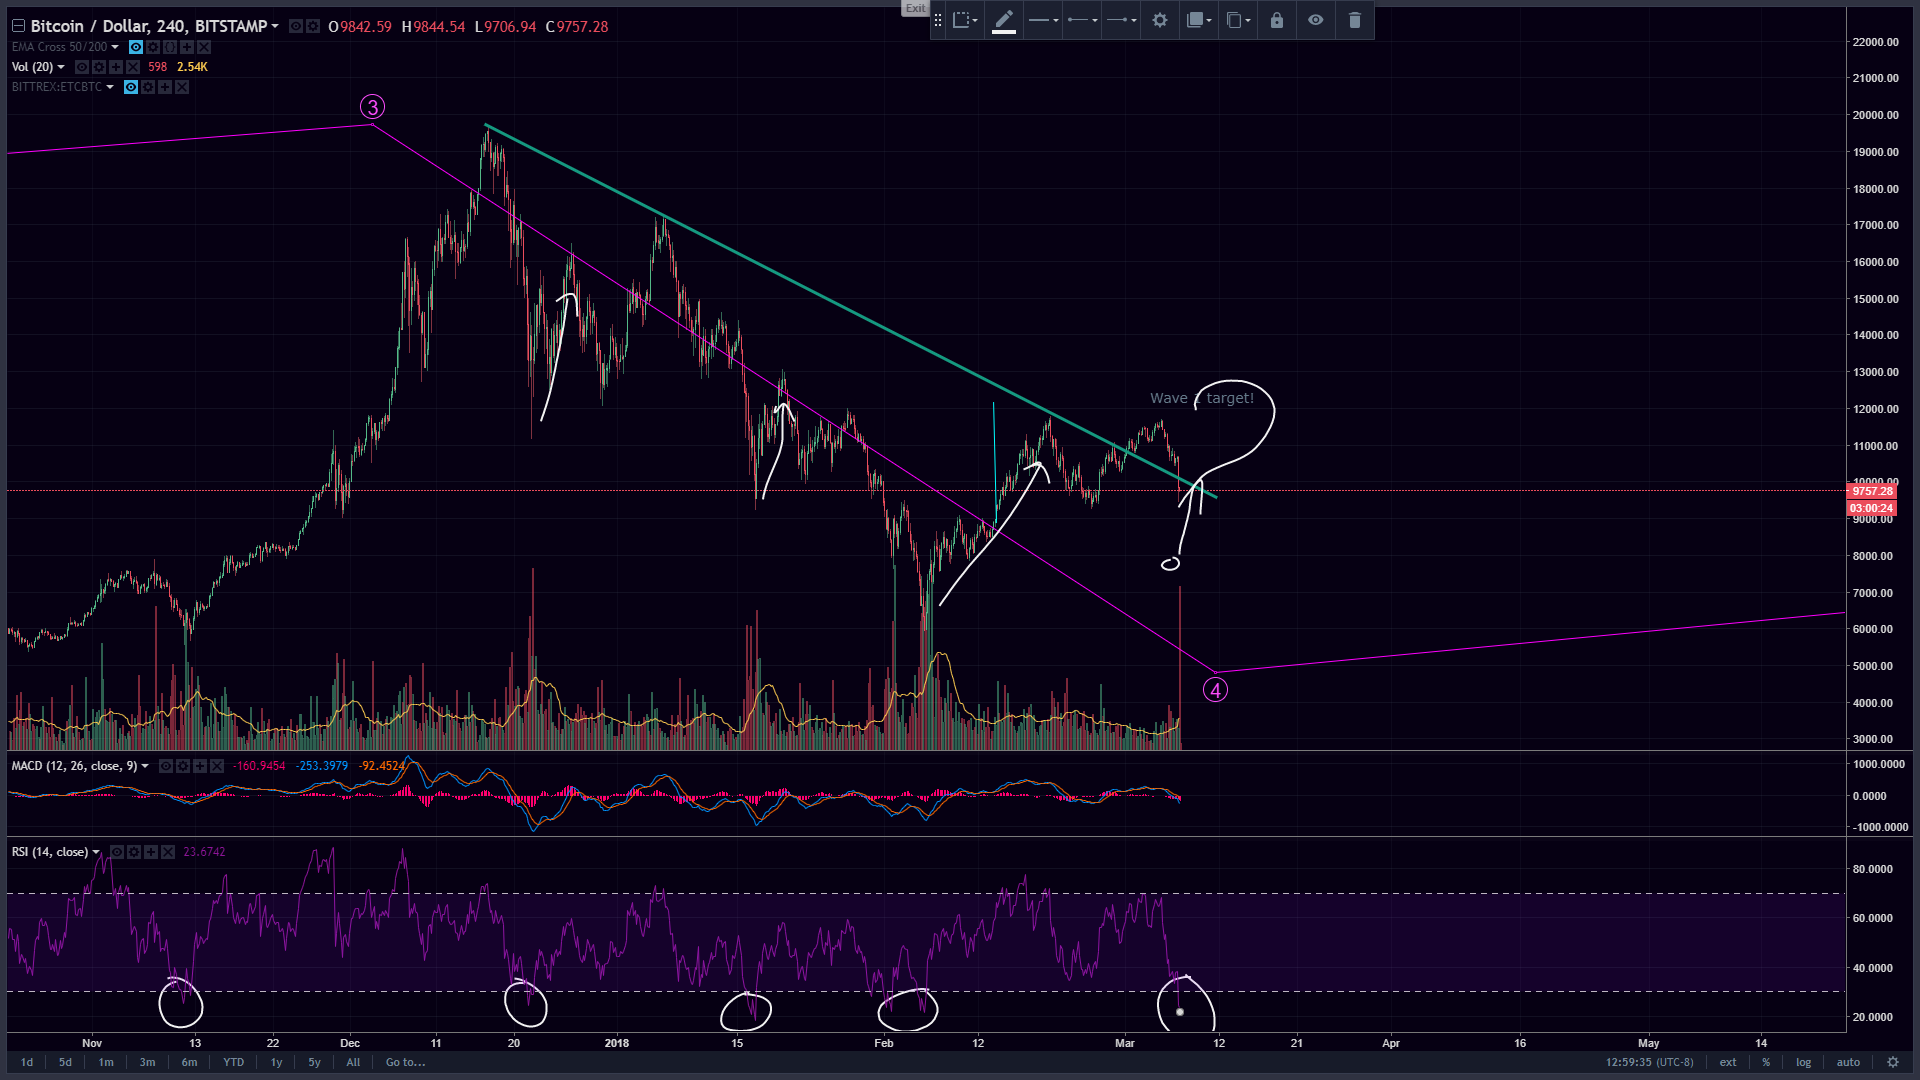
Current price hovering around $10k now breaking support volume of 10440.
Still holding, to $8,364 which will confirm the alternate count if it breaks.
Yes, there was some FUD today that increased selling 20x and pushed us down. Look for support around $9,500 low 2/25, with opportunity to buy in at $8,200, then $7,350 if it does break below the projected wave 1.
Currently, overall pattern has not been invalidated, though I have been referencing a larger correction once wave 5 completes. My count did not have that happen yet, but there is a count that supports that where we are undergoing a 3-3-5 correction.
For now, I'm HODL'ing for my current wave count, and to see the jump that usually follows a sell off. MACD is stretched to the max on the one hour chart, and RSI has us as way oversold, which has resulted in a jump each time: