What coin to trade today? October 12: Bitcoin is still King!
Bitcoin Analysis Today (October 12) - Breaking but Abnormal

#Bitcoin #BTCUSDT had a bullish day yesterday, pushing the cryptocurrency up to the 57,800 mark, very close to the strong 60,000 round mark. There has been an anomaly signal appearing on the chart, and today's Bitcoin analysis will take that signal into consideration. Invite Crypto TraderViet brothers to refer to the article.
** This article represents a subjective opinion, not investment advice
BITCOIN ANALYSIS
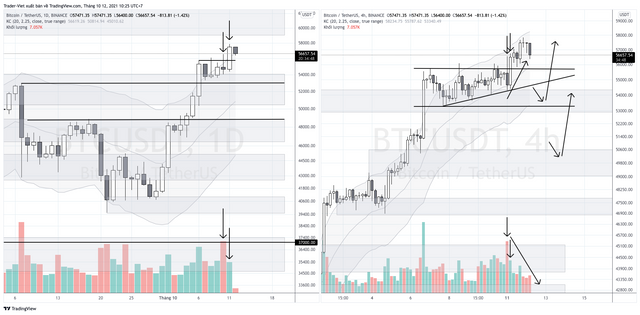
Yesterday's trading day made a break - breakout - from the previous sideways price area to create a higher high. So the uptrend continued at D1 of #BTCUSDT
The anomaly is that yesterday's bullish bar is a large bullish bar, the widest range, the widest of all the recent sideways price bars, but if you look at the volume - volume - you will see the volume The volume of transactions dropped sharply compared to the price bar with a narrower range just before. This rally, therefore, is without support from the volume side, which means it may be less sustainable.
Another signal of a possible pullback for #BTCUSDT at D1, is that #BTCUSDT on D1 has crossed and closed outside the upper boundary of the Keltner Channel envelope. This signal often leads to an overbought warning - and price may retrace back into the Keltner Channel rather than move forward.
In the current context, #BTCUSDT is also starting to approach the resistance area around the round number 60,000. Given that there has been a long span from 30,000 to 30,000, an approach to 60,000 could lead to a correction.
BITCOIN ANALYSIS #BTCUSDT FRAME H4:
A structure in the form of an Ascending Triangle Pattern - was broken to the upside yesterday for #BTCUSDT above H4, leading to a bullish span.
The anomaly on the H4 occurs where the breakout of the H4 price bar is a large bullish bar, almost in the form of a Bullish Marubozu bullish candlestick pattern, but the volume is sharply reduced compared to the previous bearish bar. there. During the next rally, volume continued to decline, despite the price going up. This divergence between volume and price could warn of a weakening in this rally in #BTCUSDT.
OVERVIEW:
The anomaly after yesterday's break at D1 and H4 in the context of #BTCUSDT approaching resistance around the 60,000 round number could be a signal that the price is unlikely to have a strong rally again.
In the short term, buying into #BTCUSDT is still more trending, but avoid buying around 60,000 as a downside correction could be encountered.
Wish you Crypto TraderViet have a good trading day
Happy & Safe Trading!!!