Bitcoin finishing correction
Hello World,
In this post I would like to share my thoughts about Bitcoin's current trend and where we might go. Before we do that I believe the big picture needs to be set. Then we can dive into current developments and discuss what the future reserves for us.
Big Picture

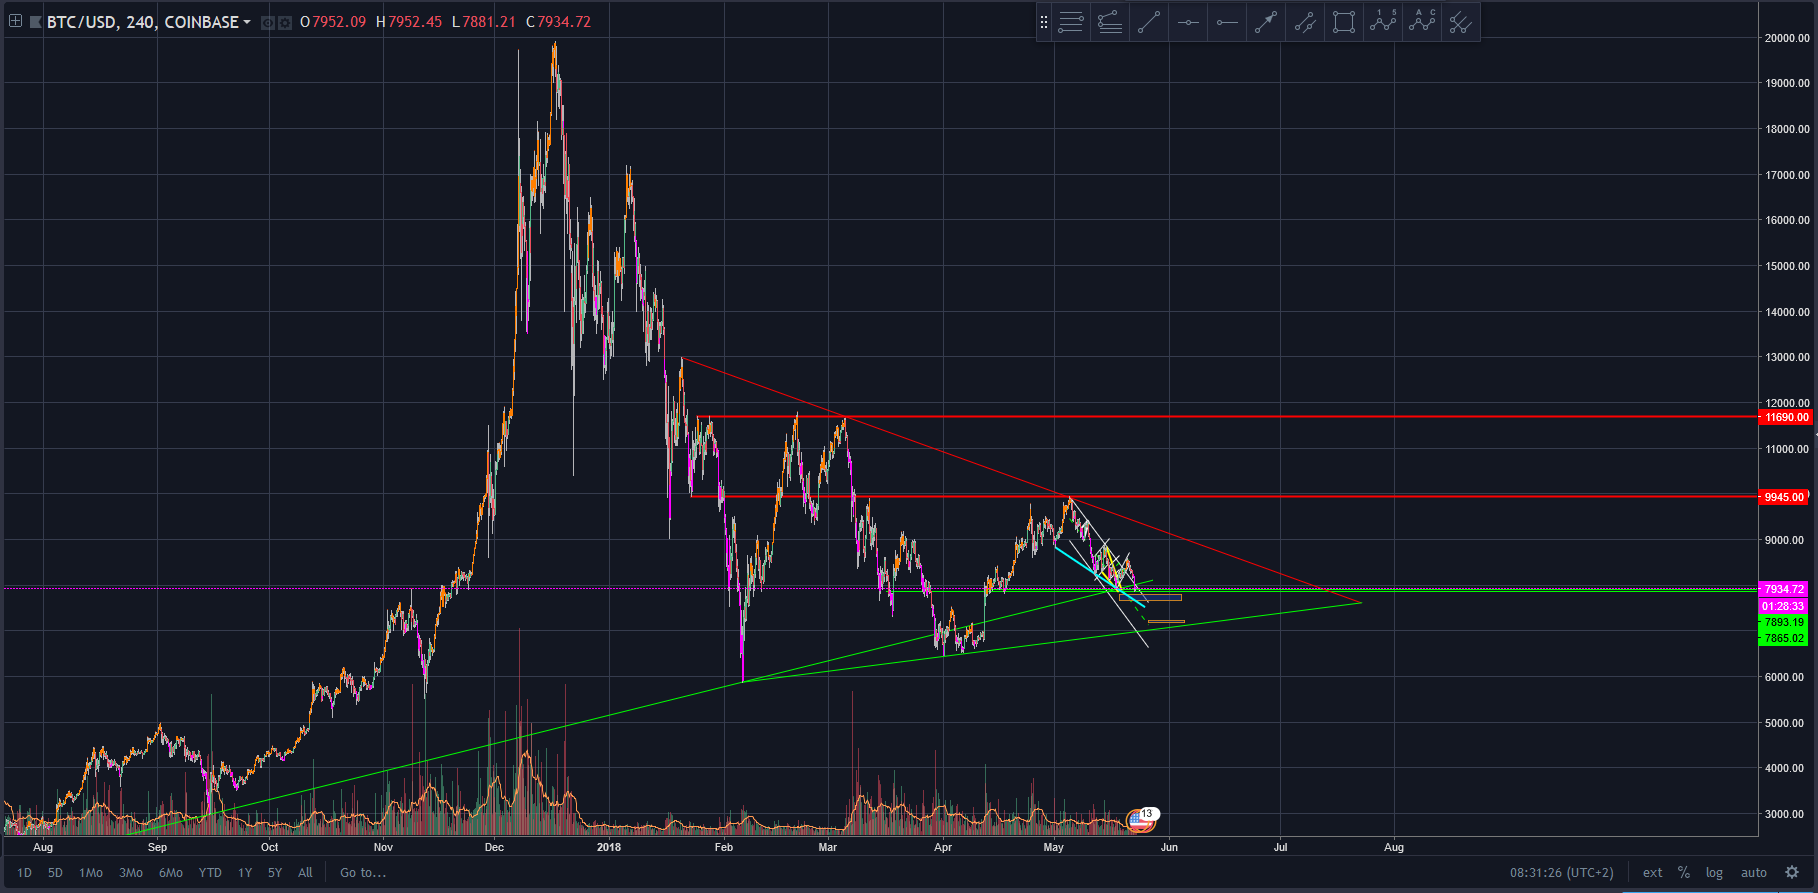
We have been travelling in a symmetrical triangle for a while now making higher lows and lower highs. While I am leaning toward the upside, this pattern can break either way. Our latest development here is the rejection from the upper side of the triangle and 9950-10000 resistance. I still have the long term trend line that we used as support back in February but I should probably take it out now as we have already chopped through it multiple times in end of March and early April as well as today.
Closer Look

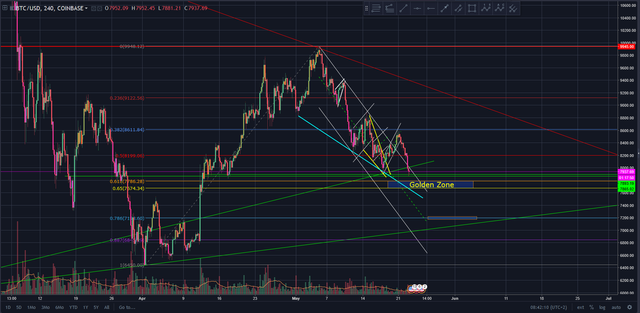
Zooming in we are in a bearish short term trend which at this moment is a correction following our swing high to the upper side of the larger symmetrical triangle. We were travelling in a downwards channel with multiple bearish patterns along the way also forming a falling wedge which in itself is a bullish reversal pattern confirming the trend as correction.
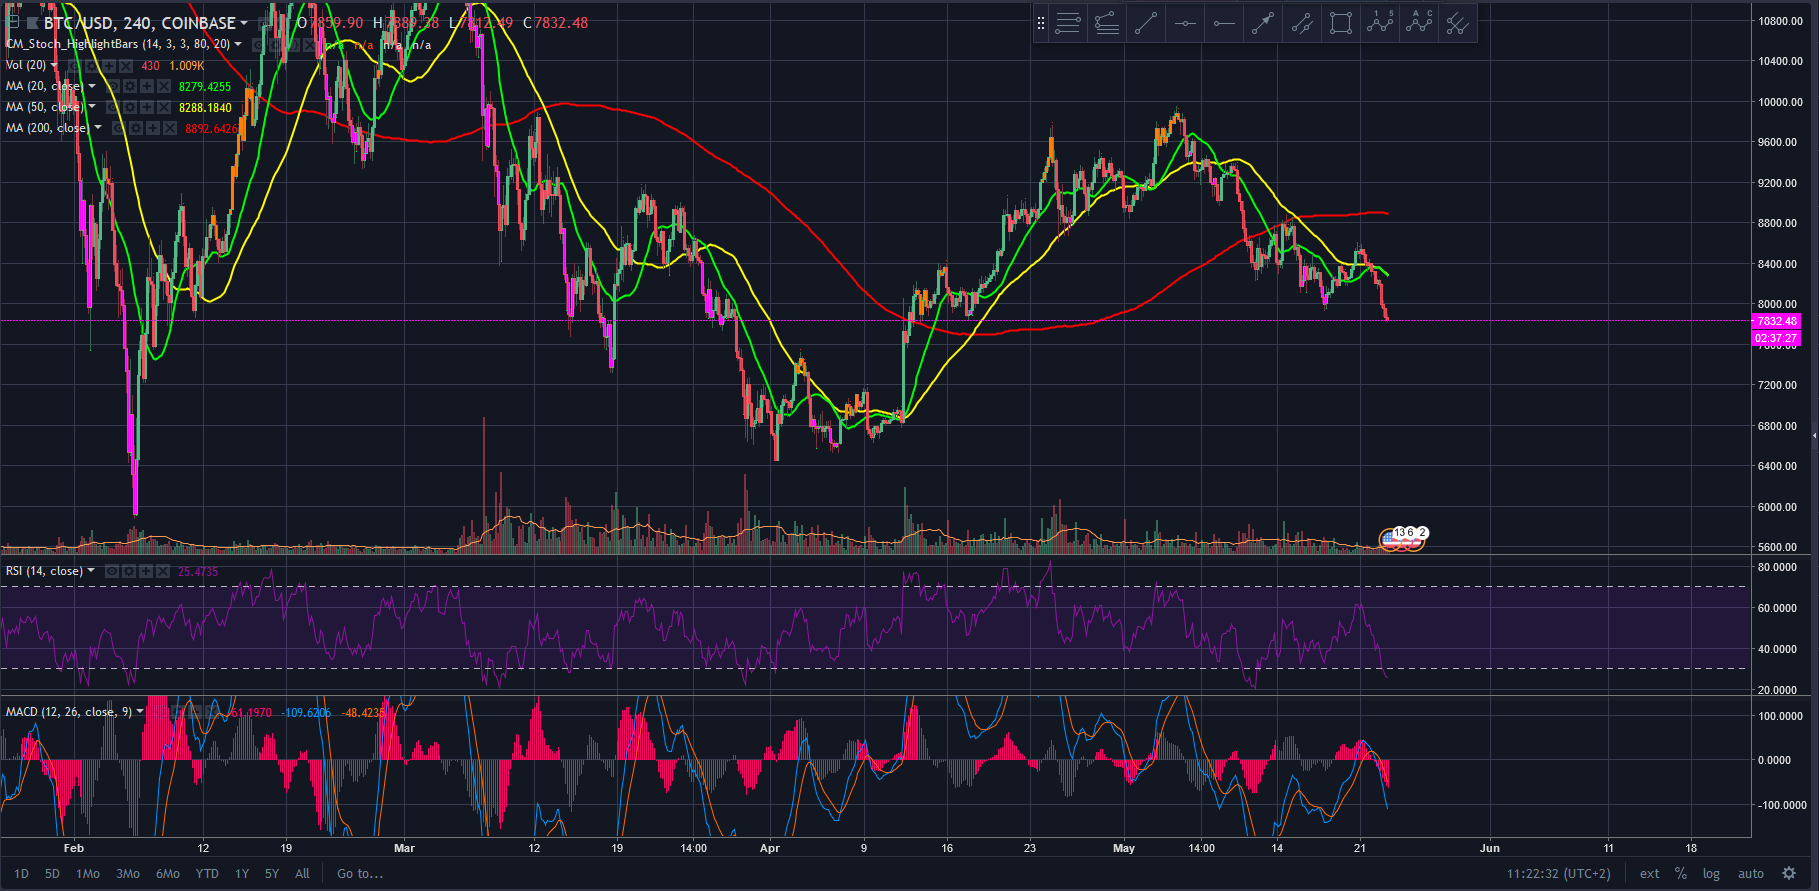
From Fibonacci Retracements point of view we could expect a bounce from 50, 61.8 (golden zone) and 78.6 values in general. We actually made it out of the channel and wedge on quite low volume below 50% retracement only to make another bear flag and fall back in. If you are an Elliott Wave practitioner this may be Wave 2 of a larger degree Wave 3. The correction of the first waves usually goes quite deep. The move lower is also supported by the fact that RSI and MACD both show bearish convergence with Stoch on daily timeframe turning down and that we are below 20,50 and 200 MA here on the 4 hour chart.

I am personally looking for the golden zone as the target (heading there right now) as it has confluence with the falling wedge and potential algo targets. If this fails we should see 78.6 level which has confluence with the lower side of the symmetrical triangle.
Following this corrective move we should see a bounce to the upside hopefully this time breaching the upper side of the symmetrical triangle. This would be a very good bullish sign although it will not fully confirm the bull run yet in my opinion.
Hope you enjoyed this analysis and if so, hit the follow here and on Twitter @CryptoMasque
*** Legal Disclaimer: I am not a financial advisor nor is any content in this article presented as financial advice. The information provided in this blog post and any other posts that I make and any accompanying material is for informational purposes only. It should not be considered financial or investment advice of any kind. One should consult with a financial or investment professional to determine what may be best for your individual needs.