Where’s the bottom? Bitcoin ending diagonal update
After all the waiting, the move down was swift and ruthless. It wiped out nearly three weeks of gains in one fell swoop and caught many with a bullish bias off-guard. It seems, however, to provide further confirmation of the ending diagonal scenario described in my previous post. The timing was also interesting, with the B wave stopping at 7.4k, just short of the 0.618 retrace of the preceding A wave. Price also bounced on the 0.25 price level of the Fibonacci Speed Resistance Fan drawn connecting last year’s high and the bottom of Primary wave A (the red diagonal shown in Chart 1).
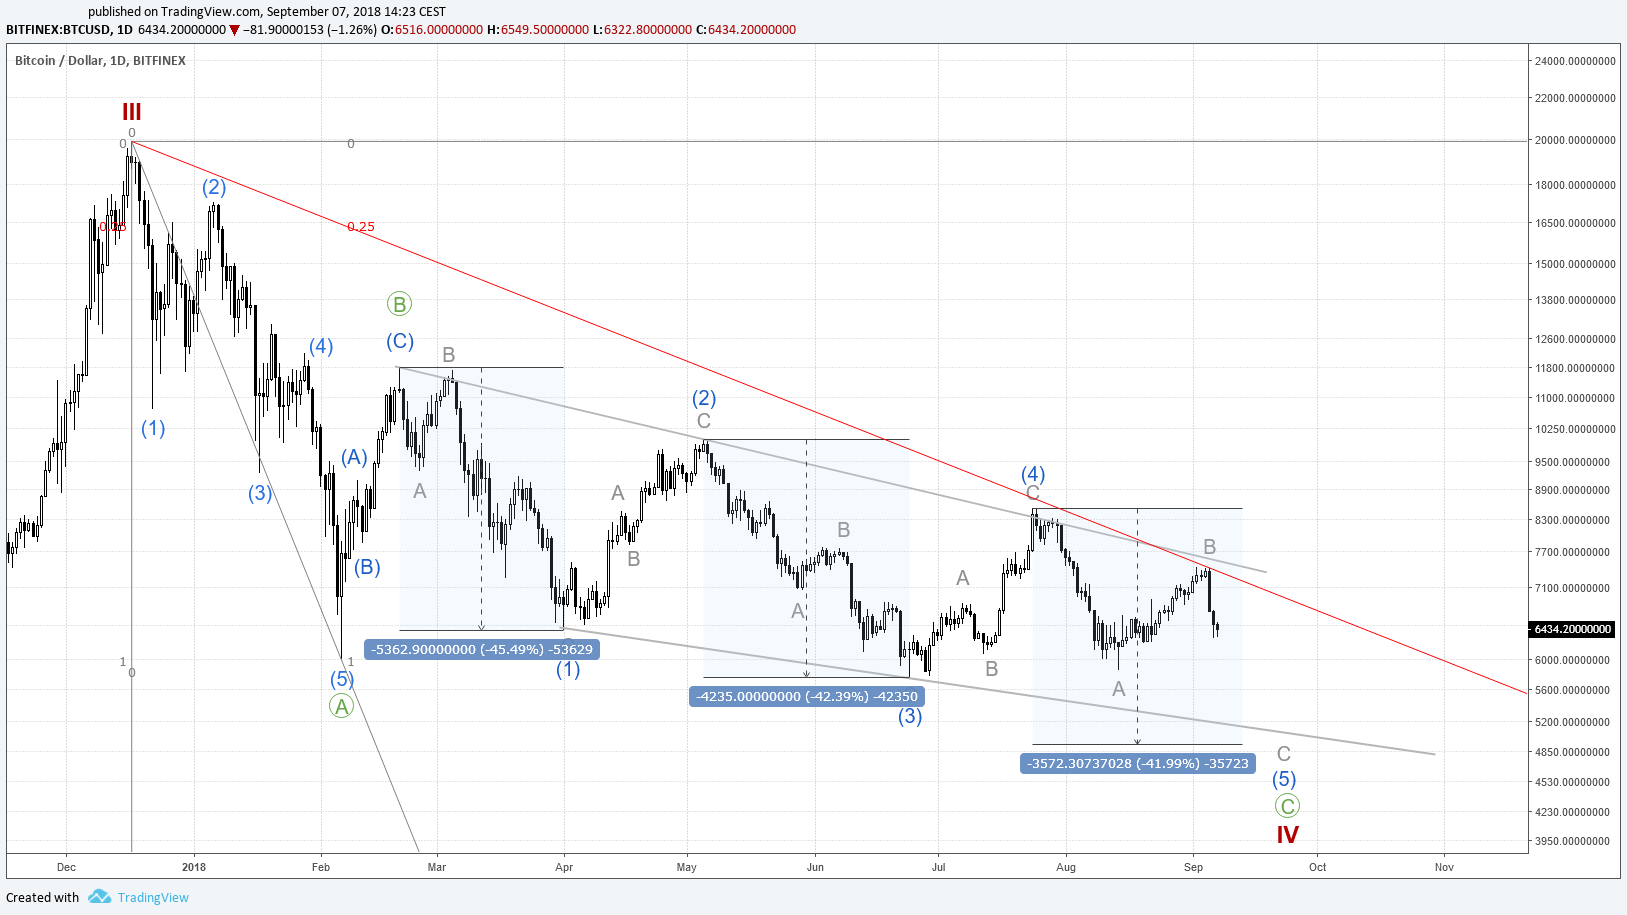
Chart 1. Bitcoin ending diagonal scenario for Cycle wave IV (click to enlarge)
What comes next?
In the ending diagonal scenario, we are now in Minor wave C of the final zigzag down (shown in more detail in Chart 2). C waves, as Frost and Prechter note, are “devastating”, just like the recent lurch down. We can now expect a short period of consolidation, maybe to somewhere in the range of 6.6–6.7k, before the next wave down. Again, keep an eye on the 0.25 Fibonacci price level shown in Chart 2.
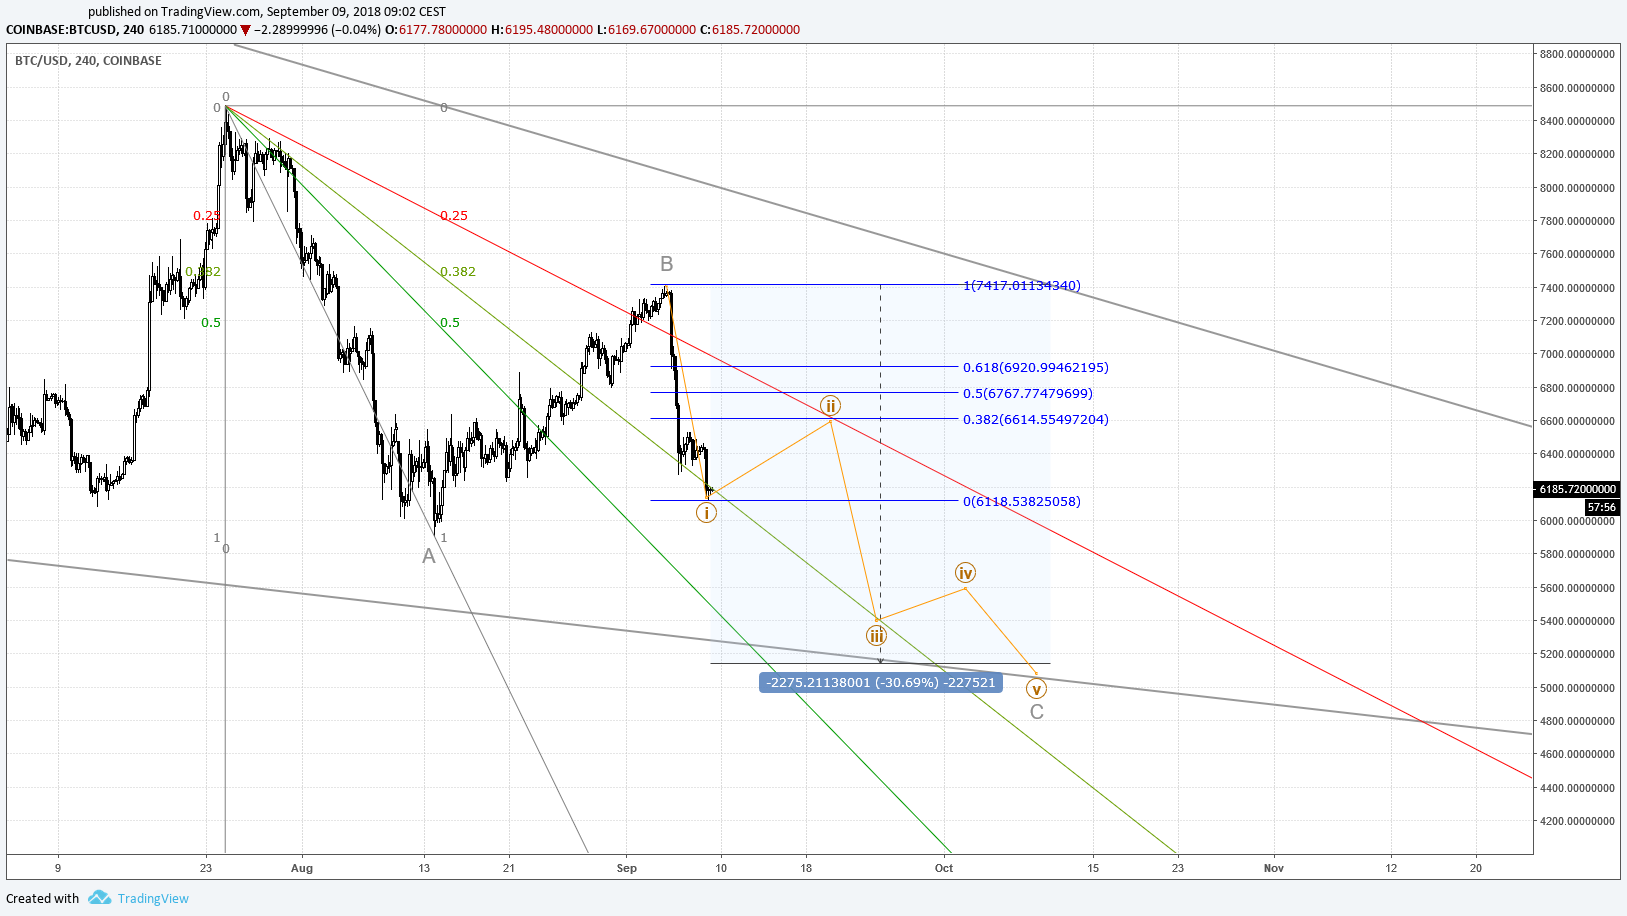
Chart 2. Bitcoin Intermediate wave 5 (click to enlarge).
Landing zone
The successive motive waves of an ending diagonal should be decreasing in size. Going back to Chart 1, wave 1 was around 45 percent and wave 3 around 42 percent. This suggests that wave 5 should be limited to around 4.9k. Depending on how fast events play out, this could allow for a modest throw-over of the bottom line of the descending triangle. On the other hand, note that Minute wave A travelled around 30%. A further 30% drop in Minute wave C would take price to around 5.2k. Chart 2 shows how events might play out.
Rocket man
So, exit bears; enter the bulls? The correction is nearly done and we should get set to blast off for the moon? Perhaps not. One scenario that’s worth bearing in mind is that this could be the first part of a corrective WXY correction. That would mean that after the ending diagonal, we would see an X wave up at Primary level followed by another Y wave down to a lower low (shown in Chart 3).
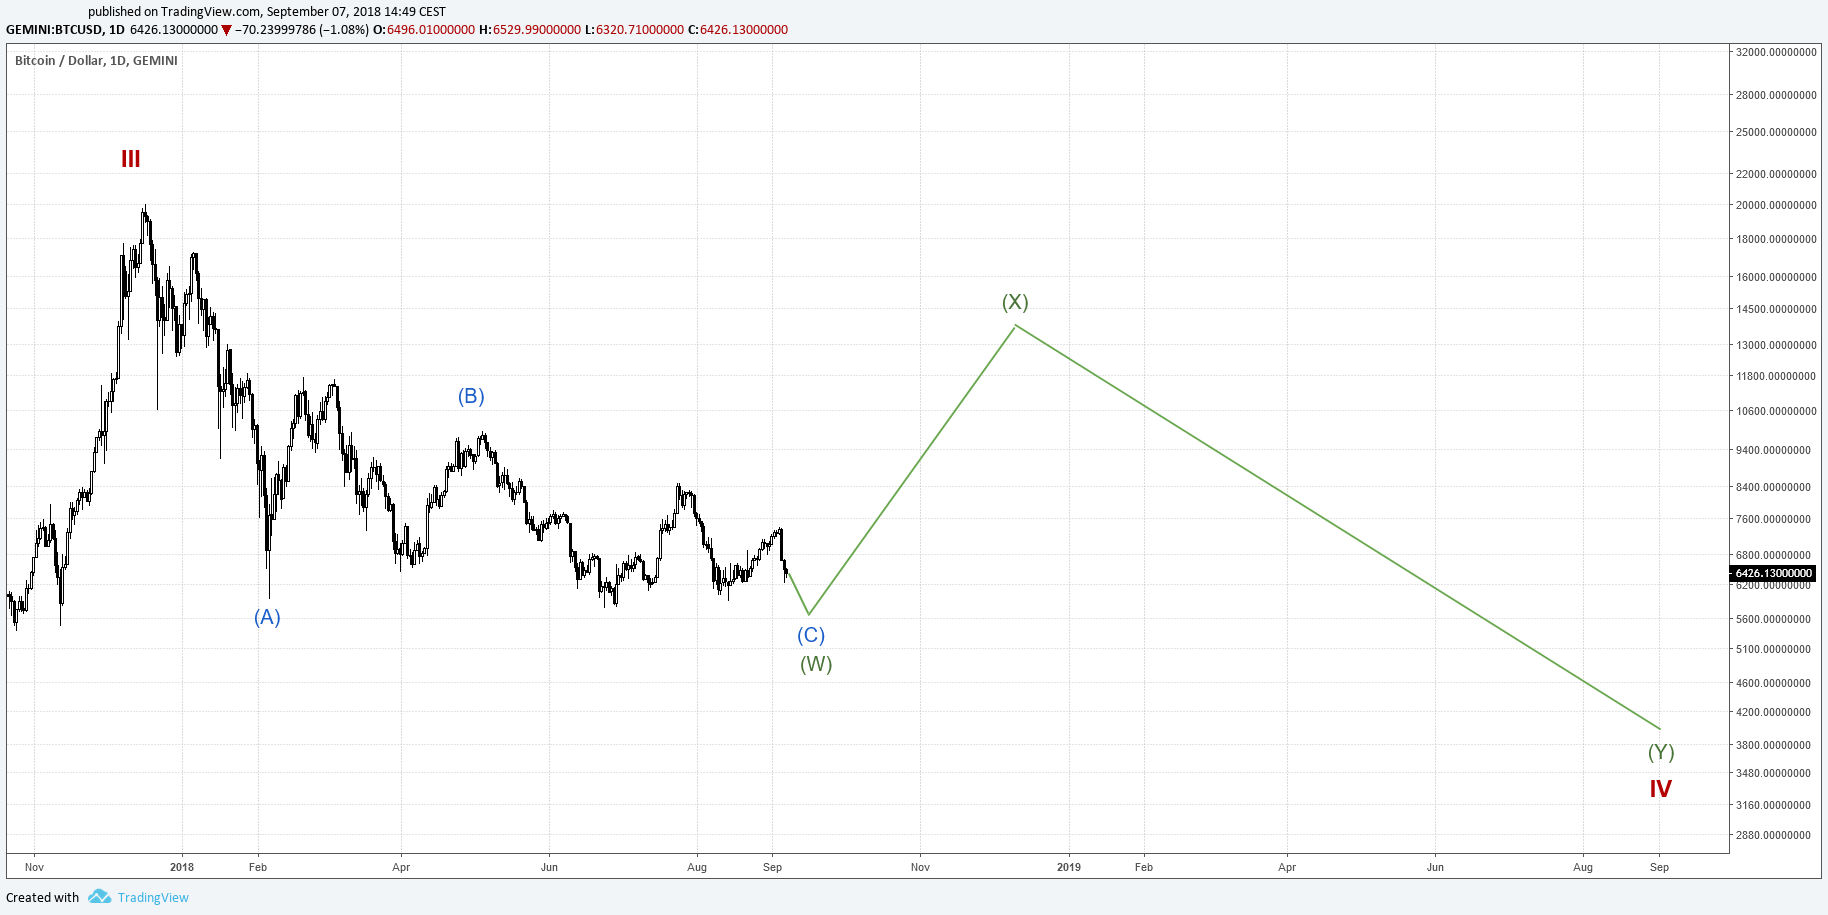
Chart 3. WXY scenario for Cycle wave IV (click to enlarge).
However, such a scenario remains unlikely. Given that the correction in 2014–2015 (Cycle wave II) was of a complex nature, by the rule of alternation, this correction (Cycle wave IV) should be short and sharp. It may seem like aeons have passed since the giddy heights of December 2017 (264 days to be precise), but this is nothing compared to the last multi-year bear market. This ABC would be much shorter and sharper.
Will We get to 5k? Will it hold?
Disclaimer: I am not a financial adviser. Nothing in this post should be taken as financial advice. All content is provided for information purposes only.
All text copyright @cryptolaidlaw 2018. All rights reserved.
Probably $800...better to collect some better Free Cryptos
Posted using Partiko iOS