Bulls beware: B-wave flat scenario for the bitcoin 2018 correction
My previous analysis of this year’s bitcoin correction, which had the symmetrical triangle that formed between February and June as the B wave of an ABC sequence, has been invalidated by the surge in the bitcoin price over the last week or so. Crypto appears to have found a new lease of life, with lots of bullish chatter on twitter. Technically, however, there are still grounds to be cautious. The correction may not yet be complete and lower lows may lie in store.
This updated analysis sticks with the large impulse wave down from last year’s all-time high of nearly USD 20,000 as wave A of a zigzag ABC. This means the current consolidation remains the B wave in this sequence, to be followed by another primary impulse down, which would form the C wave. A solution to the B-wave count was suggested by the WXY scenario shared by @cryptonomic on Twitter in June. The chart shows that price action from February to present formed part of an ABC flat correction, meaning that the current price surge could be attributed to the C wave of this flat. Note this is also consistent with Frost and Prechter’s observation that advancing C waves in a downtrend are often mistaken for the start of a new upward swing. Naturally, once this C wave—and hence the flat pattern—is complete, it would be followed by another round down.
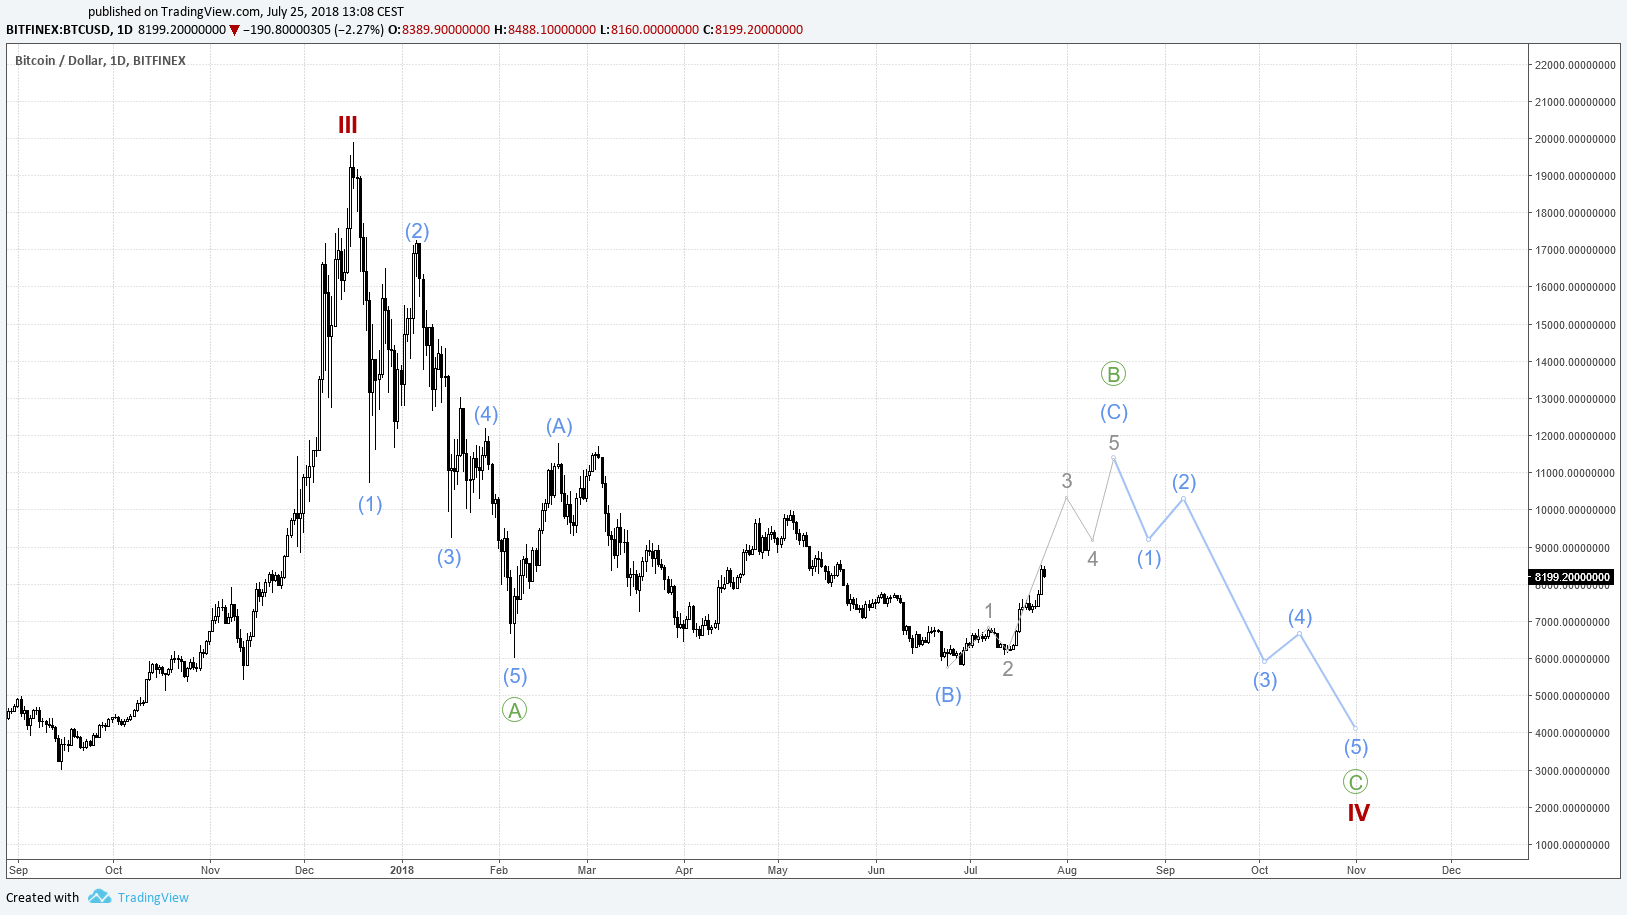
Chart showing the B-wave flat scenario (click to enlarge).
The chart shows the primary impulse down (green A), followed by the intermediate A and B waves of the flat in blue. We are now in the C wave of this flat, after which we can expect another impulse down.
In terms of numbers, the A wave of the flat travelled around USD 5,800 (from the bottom around USD 6,000 to its top around USD 11,800). The B wave travelled around USD 6,050 (from the top of USD 11,800 to the recent bottom around USD 5,750). This makes wave B around 104% of wave A, in line with the guidelines for a flat. The guidelines also state that wave C is often between 100% and 165% of wave A, which would give a target range for the C wave between USD 11,550 (although perhaps less if a running flat) and USD 15,300 for an expanding flat. Note also the major resistance zones around USD 12,900 and USD 14,600).
If the expanded flat scenario is correct and particularly if bitcoin does manage to break through the resistance established by the double-top around USD 11,800, many people will be caught off guard. Such a scenario would prove to be the mother of all bull traps.
Disclaimer: I am not a financial adviser. Nothing in this post should be taken as financial advice. All content is provided for information purposes only.
All text copyright @cryptolaidlaw 2018. All rights reserved.
Hi, great post, worth a follow. Looking forward to some more of your stuff.
Hi, great post, worth a
Follow. Looking forward to
Some more of your stuff.
- cryptoissweet
I'm a bot. I detect haiku.
Thanks for the feedback :)