Bitcoin: the slow and painful scenario
Lots of people are convinced that the bitcoin price is gearing up for a huge lurch down – fear, loathing and capitulation, or something along those lines. Asides from completing the final stages of the the ubiquitous ‘psychology of a market cycle’ chart, this would have the added advantage of putting everyone out of their misery.
There is, however, an alternative scenario that might be worth having in mind. It’s still based on a 3-3-3-3-3 ending diagonal. Let’s call it the ‘slow and painful’ scenario.
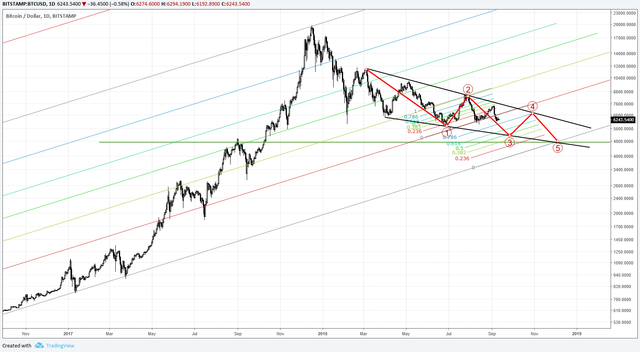
As the chart shows, in this scenario, the ending diagonal is much more extended in time. Remember, ending diagonals occur when the preceding wave has gone “too far too fast”. Given the 70 percent drop in January this year, this protracted sideward descent actually makes perfect sense. There are also a number of other factors that make it persuasive. The chart shows how it would give price the time to reach the bottom of the Cycle level channel (the bottom grey sloping line in the chart) and would see the correction finish around the support at 4,750 USD.
The duration of this correction may be killing us. Our instincts may tell us to expect a dramatic denouement. But perhaps we’ll need to find the patience for a slow and painful end to the 2018 correction. As always, time will tell.
Nice read. I leave an upvote for this article thumbsup