Bitcoin and Litecoin both show signs of another leg down
This post presents a possible scenario for cryptos regarding the major correction that began at the start of last year. Two charts are shown below, BTCUSD and LTCUSD (both on the daily scale), with details of a potential wave count for the major correction that began following last year’s all-time high.
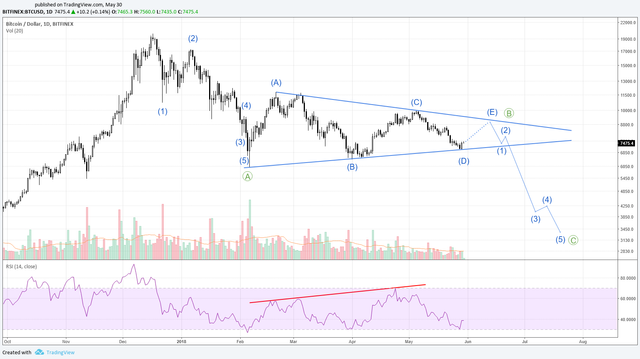
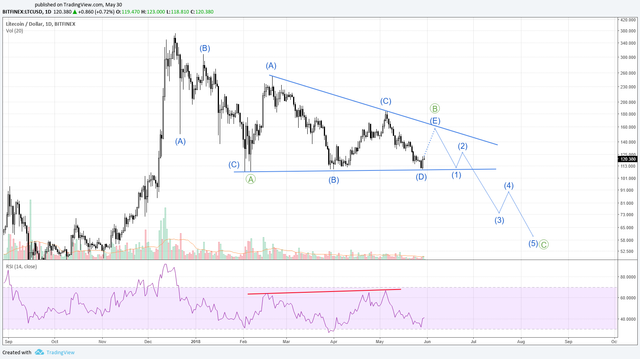
Both charts are highly similar. In both cases, I believe we are in the final stages of a triangle formation (contracting in the case of BTC and a barrier-type in the case of LTC) that could form the B-wave in an ABC correction (marked in green). In this scenario, the end of this triangle (note that the E-wave can itself turn out to be a triangle, thus drawing out the B wave even further) would be followed by a C-wave impulse down.
Why this interpretation? Simply put, price does not appear to have corrected enough since last year’s all-time high. I believe we are seeing a correction that marks the end of a prolonged uptrend that began after the 2014 bear market, so retracement must be substantial. Also note that the 2014 correction was a complex sideways action, so the proposed ABC correction fits with the guideline on the alternation of correction types. There are also aspects of volume and the relative strength index that support this scenario.
Volume
In both cases, volume continues to dwindle, suggesting that buyers and sellers are cautious and retreating from the market. The influx of new money that propelled cryptocurrencies to all-time highs last year has dried up and although institutional money appears to be preparing to enter the market, many investors may be waiting on the side-lines to see how this correction resolves.
Relative strength
Also, in both cases, the relative strength index (RSI) is showing signs of divergence (marked on the charts using a red line). Notice how the lower highs in the triangle correspond to higher highs on the RSI. This suggests that greater buying pressure is failing to deliver higher highs; in other words, more effort by buyers to reach lower highs.
Conclusion
There is also a scenario in the case of bitcoin, whereby the whole correction could be conceived as a giant triangle and thus a continuation pattern in an uptrend. However, the fact that the horizontal line of the barrier triangle for litecoin is on the bottom suggests a break downward is impending for both. Last year’s all-time high most likely marked the end of wave three in a long-term cycle, which needs time to correct. After resolution of this correction, wave five should follow.
Disclaimer: I am not a financial adviser. Nothing in this post should be taken as financial advice. All content is provided for information purposes only.
Congratulations @cryptolaidlaw! You have completed some achievement on Steemit and have been rewarded with new badge(s) :
Click on any badge to view your Board of Honor.
For more information about SteemitBoard, click here
If you no longer want to receive notifications, reply to this comment with the word
STOPDo not miss the last announcement from @steemitboard!