Three scenarios to be aware of for bitcoin
Bitcoin price action over the past few weeks remains inconclusive. After being repelled for the third time by the top of the diagonal trendline, price remains trapped in a no man’s land of protracted consolidation with no clear end to the downtrend in sight. Let’s take a look at three scenarios.
The triangle
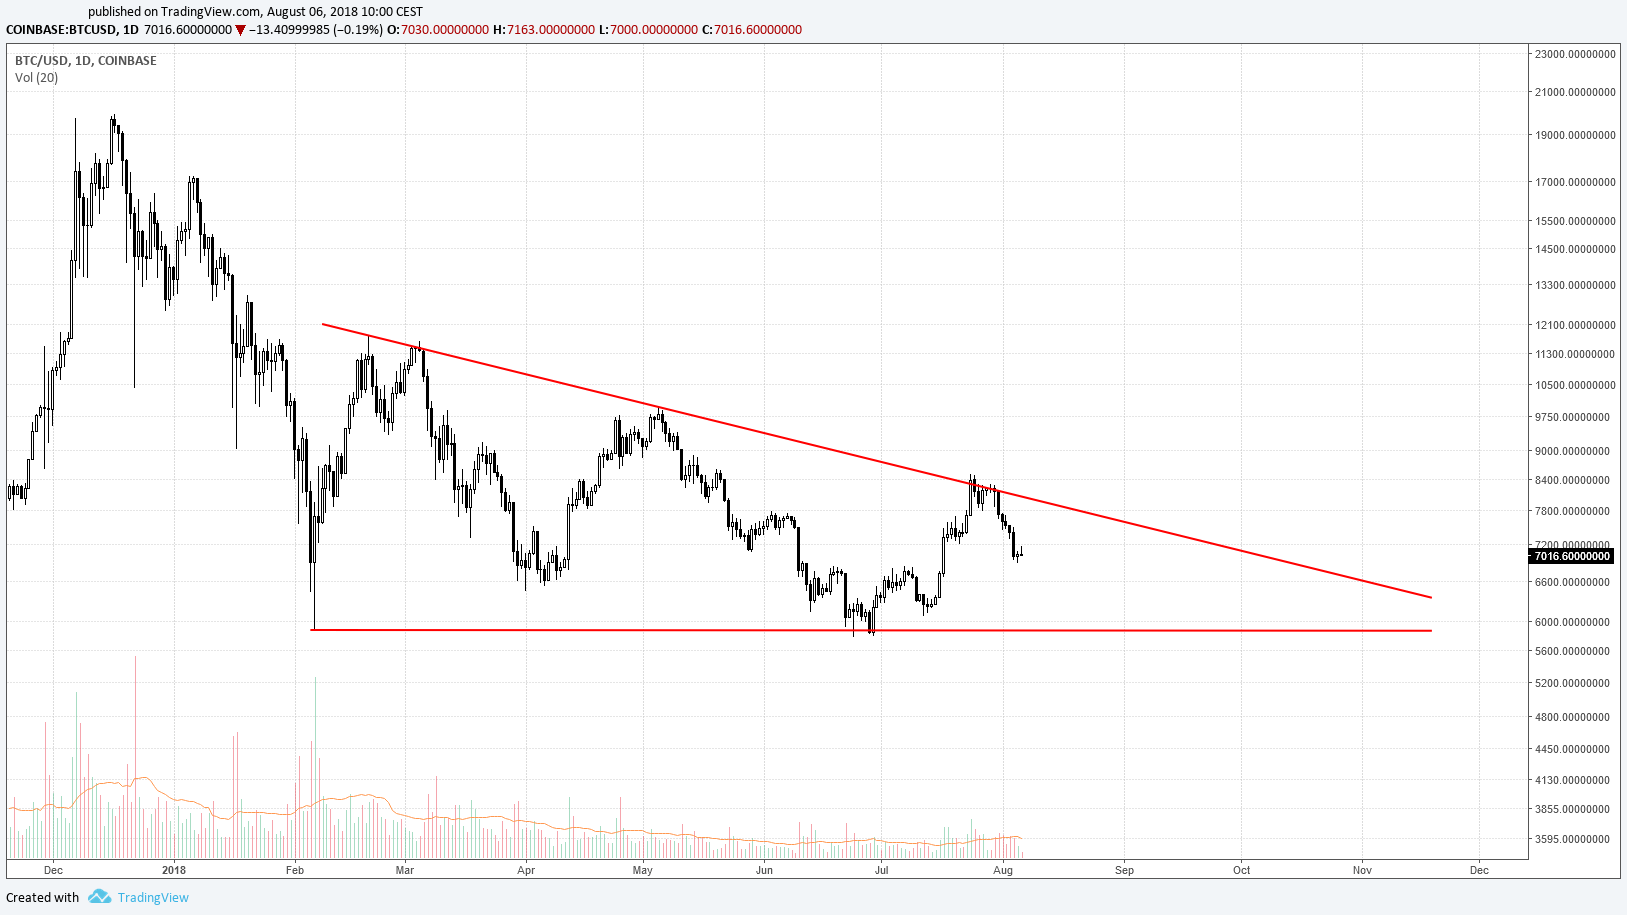
Chart 1. Barrier triangle (click to enlarge).
One of the first observations, shown in Chart 1, is that the two-week recovery in the bitcoin price failed to break the top diagonal of the triangle described in a previous post, despite trying to poke its head above. This is an interesting development, since it suggests this line is important and that a pattern based on the triangle might still be in play. There is also the horizontal support line based on the two sub-6k bottoms, which would give a rather bearish-looking barrier triangle that remains in play until we see a decisive breach of the upper diagonal. There is still plenty of space for this triangle to mature and it could even contain price action until the end of the year. Either way, it would be wise to err on the side of caution until price decisively breaks out of the triangle.
The ABC flat
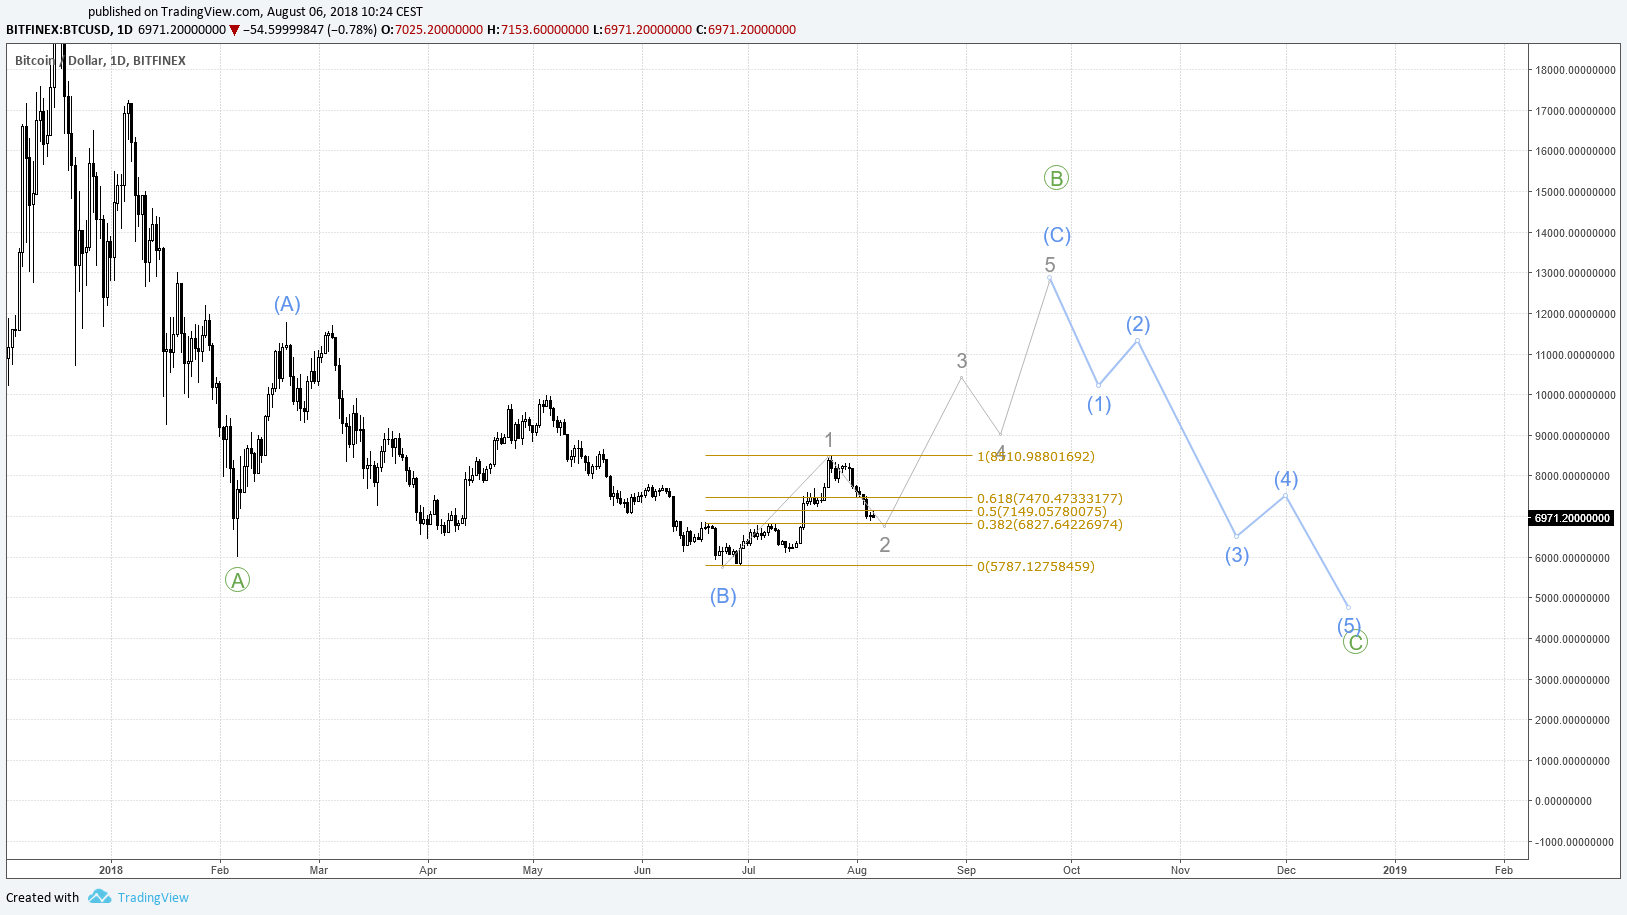
Chart 2. ABC flat (click to enlarge).
Another possibility discussed in a previous post is the idea of a flat pattern, which could take price as high as USD 13,500 before the final leg down in the ongoing correction. As Chart 2 shows, this short-term-bullish scenario is still in play and the price surge over the last two weeks or so may well have been wave 1 of the C wave with the subsequent correction being wave 2. The only issue with the flat is that the A wave was extremely quick (lasting around two weeks), while the B wave took over three months. Nonetheless, this scenario is important to keep in mind, since, as mentioned in the previous post, if price breaks the USD 11,700 resistance, this could prove to be a bear trap of spectacular proportions.
The Wedge
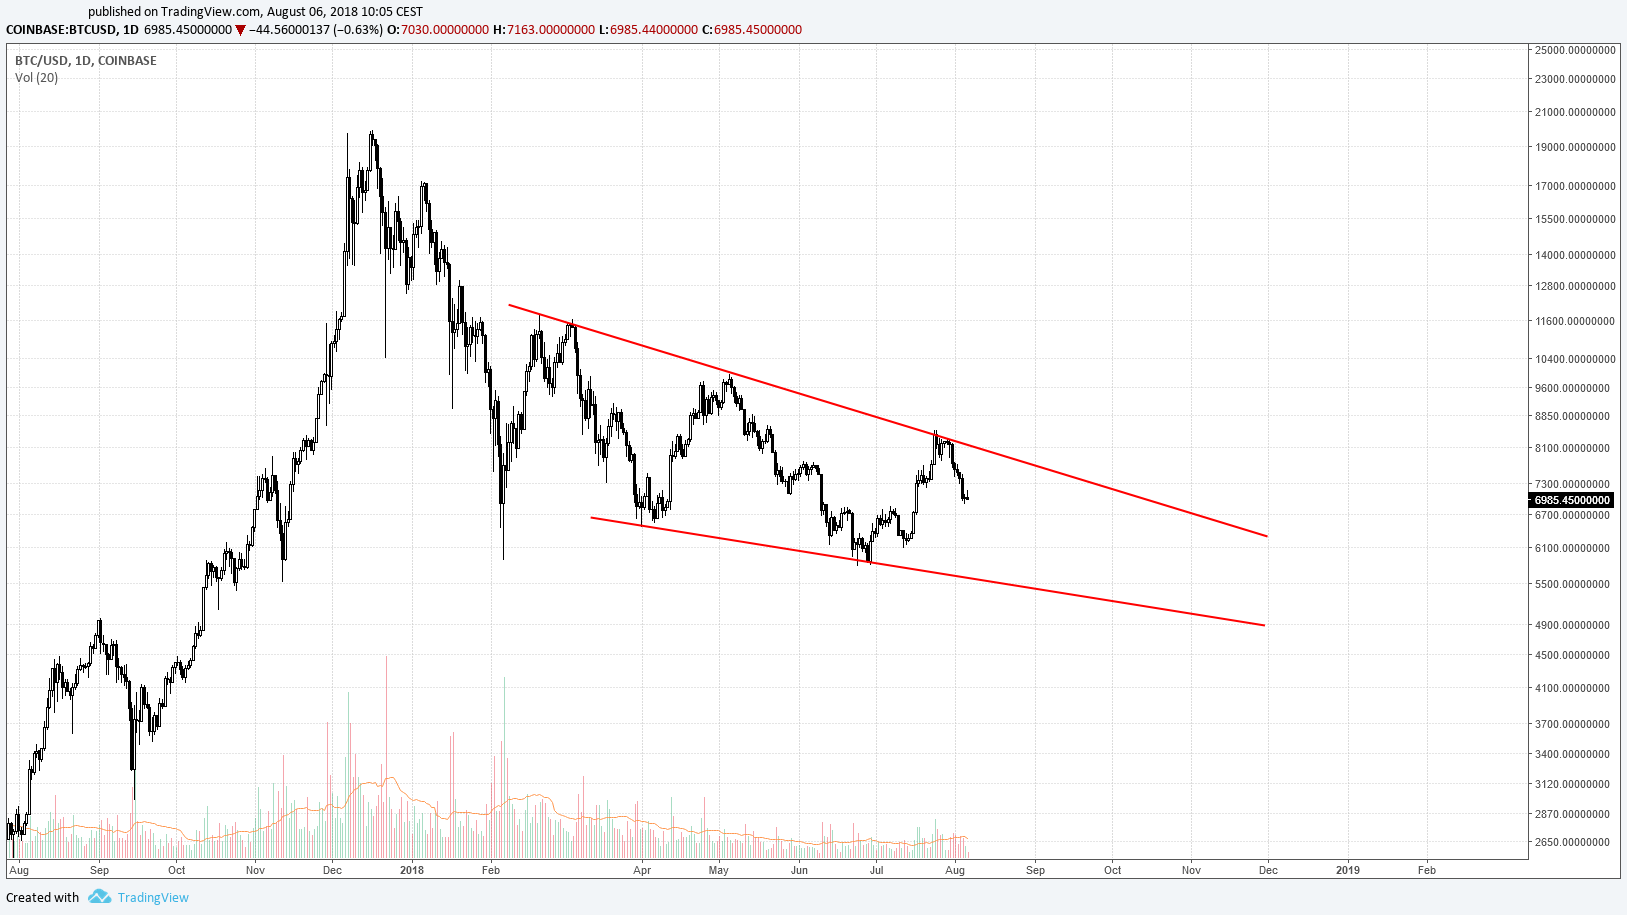
Chart 3. Wedge (click to enlarge).
A third and final pattern to bear in mind is the descending wedge formation shown in Chart 3, which could prove an alternative to the barrier triangle mentioned above. Again, this would suggest caution and patience until a decisive break of either the top or bottom trendline (which could take some time).
Relative strength and money flow
Divergence on the Relative Strength Index (RSI) and Money Flow Index (MFI) both provide useful clues as to future price action and there are some interesting observations in this respect.
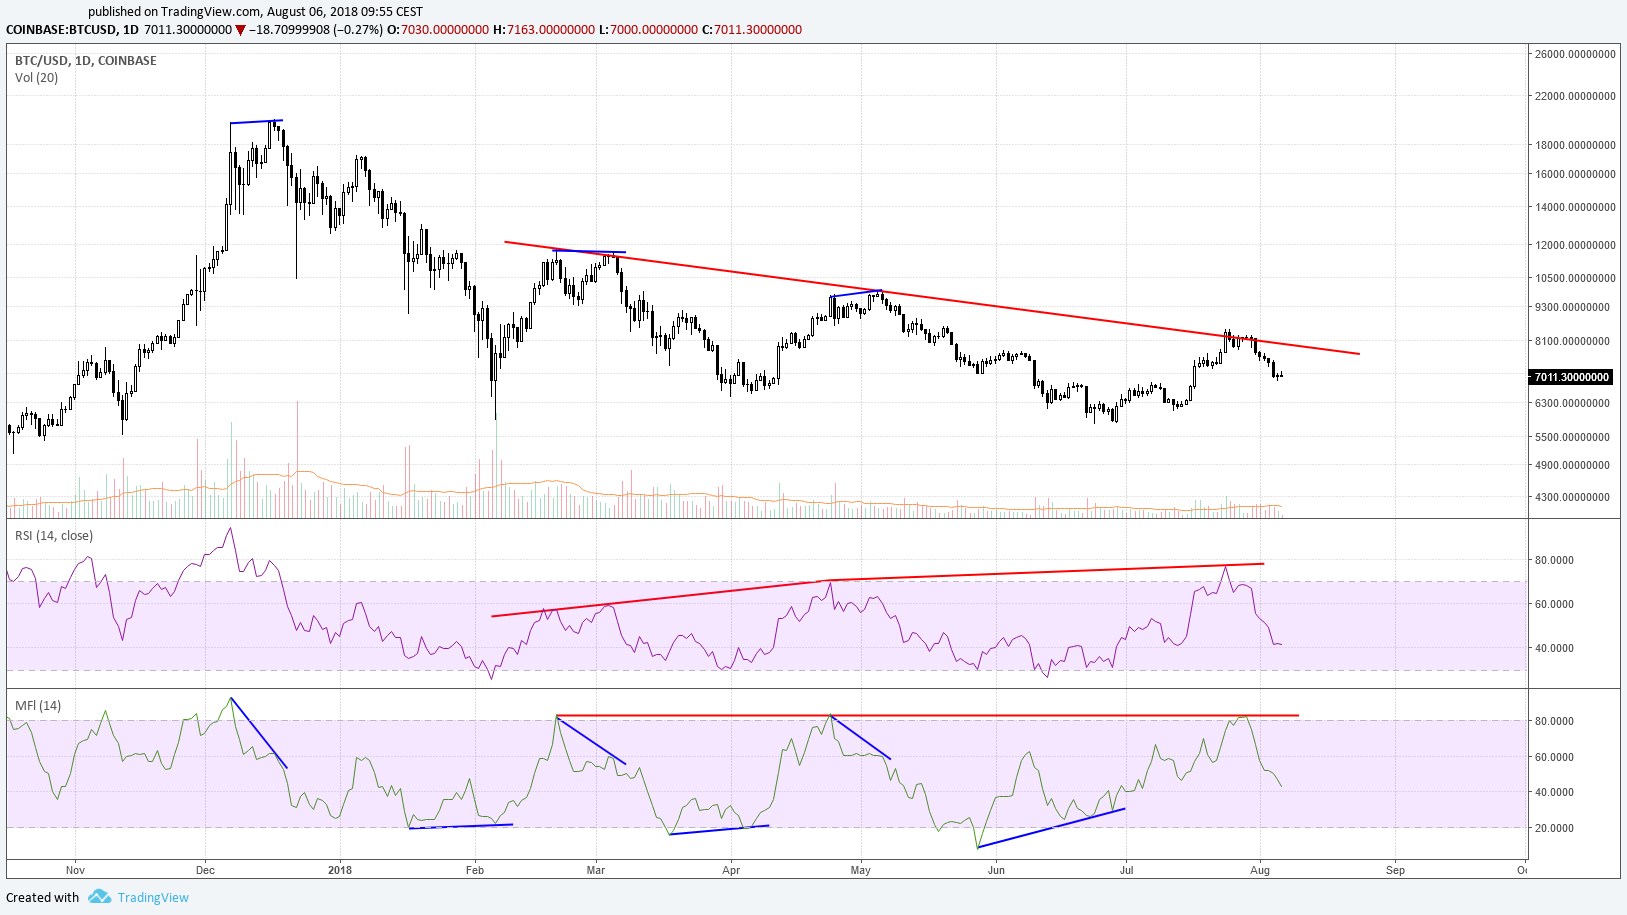
Chart 4. Daily RSI and MFI (click to enlarge).
In Chart 4, we can see some hidden bearish divergence marked in red on the daily RSI, where the three lower highs of the descending diagonal trendline have all resulted in higher highs on the RSI (and a triple top on the MFI). Essentially, this shows that increased buying power is failing to translate into higher highs and is thus a bearish signal. It suggests bitcoin may struggle to breach the upper trendline of the triangle and wedge discussed above. Another interesting point to note on this chart is how divergence on the MFI has been extremely successful at predicting the tops and bottoms during the 2018 correction (marked in blue on the chart).
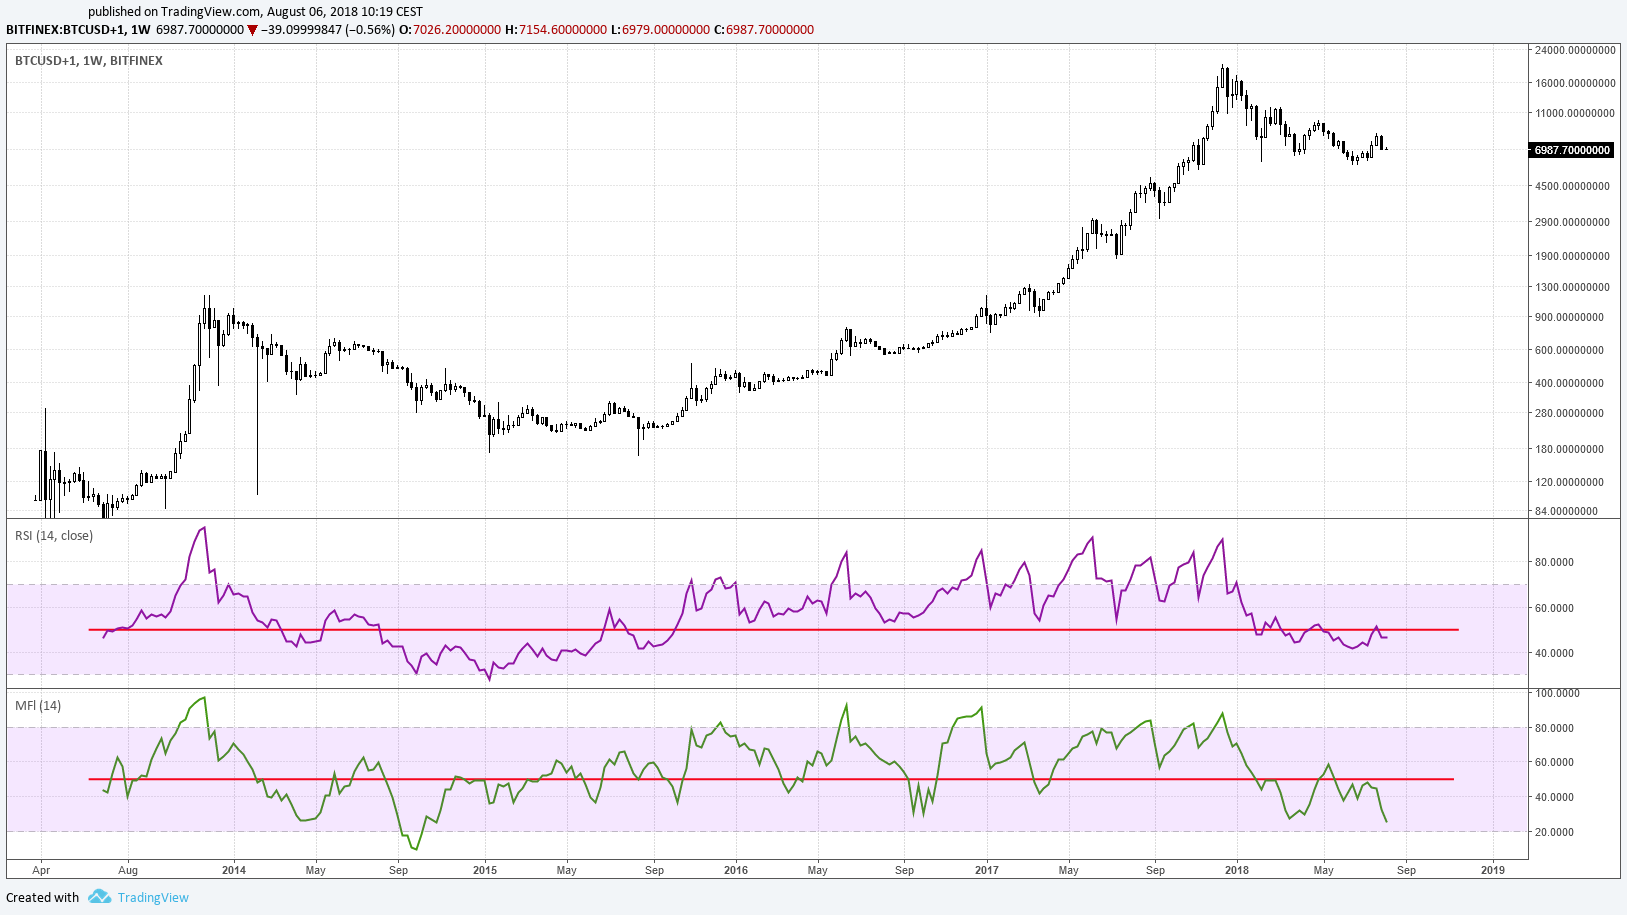
Chart 5. Weekly RSI and MFI (click to enlarge).
Finally, Chart 5 shows that both RSI and MFI on the weekly have struggled to break above the midway point of 50, a clear sign that for the time being, bitcoin remains trapped in a downtrend.
Indecision and patience
In short, the charts are inconclusive and the current consolidation could go on for some time. A decisive break above USD 8,000 would be bullish, at least in the short- to medium-term, while failing to hold the bottom of either the triangle or the wedge would most likely lead to swift capitulation and the end of the correction. For now, though, patience is required, since bitcoin will remain in a downtrend until we see a higher high and higher low. Unfortunately, this could take quite some time.
Disclaimer: I am not a financial adviser. Nothing in this post should be taken as financial advice. All content is provided for information purposes only.
All text copyright @cryptolaidlaw 2018. All rights reserved.
Excellent analysis. Love all the different ideas that went into this. That bearish divergence on the 1 day is enough to keep me away right now. But I will be watching it closely for signs of a potential reversal over the next few days-weeks. Thanks for sharing!
Congratulations @cryptolaidlaw! You have completed the following achievement on Steemit and have been rewarded with new badge(s) :
Click on the badge to view your Board of Honor.
If you no longer want to receive notifications, reply to this comment with the word
STOP