Bitcoin looking solid!
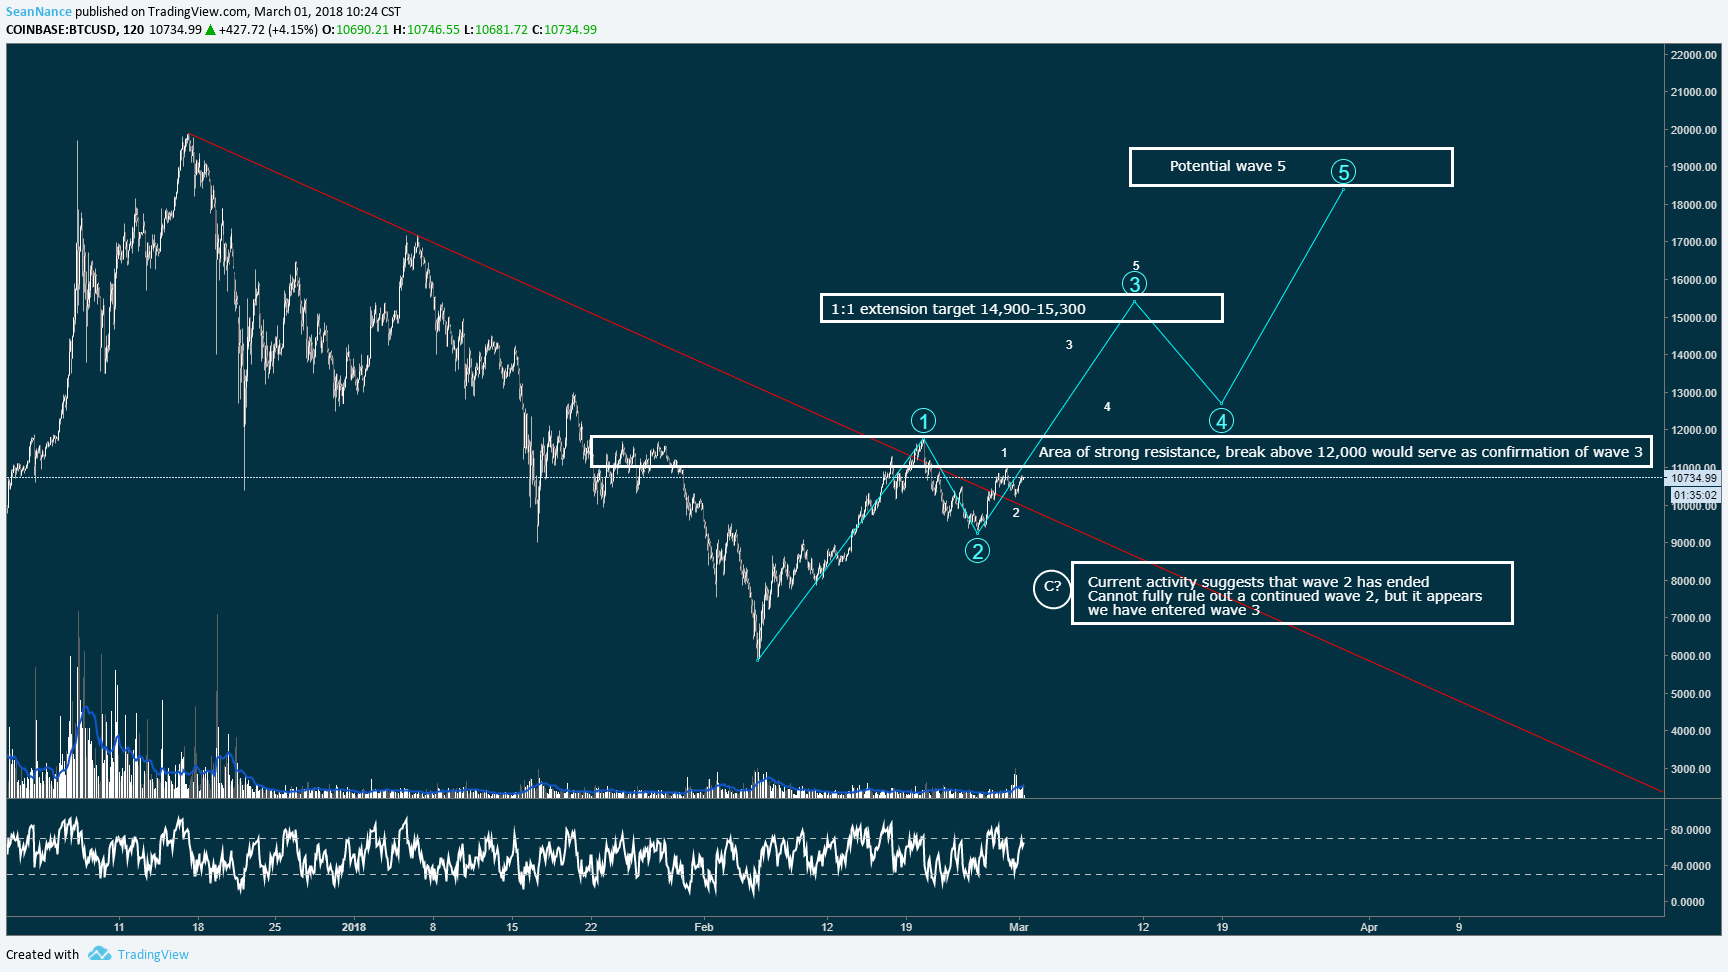
I previously posted this chart and very little has changed. We don't have full confirmation that wave 2 has ended, but all appearances say that it has. The red line that has been added represents the downtrend from 20k. you can see that we are currently fully above that line. If we view the daily candles, we have closed 2 candles above this line and opened a third. This is very positive for a wave 3.
As many are aware, wave 3 is often the longest wave and we are entering subwave 3 of wave 3 movements. This indicates that it's likely a good time to enter alt positions as well. When Bitcoin is performing well, alts have even more opportunity. As we get closer to previous highs we should expect some to move into Bitcoin from the alts with their expectation of breaking the previous high. The current chart suggests that we may test the previous high, but we likely won't break it.
Here are the daily candles:
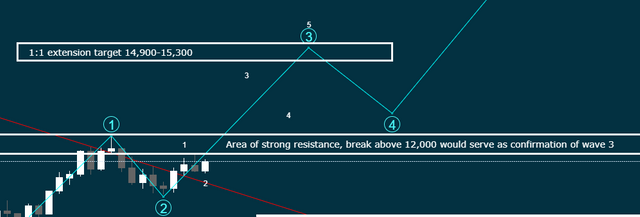
Note that we have not suggested wave 5 targets yet. Early indications suggest a test of that previous high, but we will analyze this more as we get closer. Wave 3 could also surpass expectations, my suggestion would be to set a stop loss when we get to those levels and manually follow BTC up as it trends higher.
As always, set a stop loss or be alert in case Bitcoin decides that charts are out the window.
Join us on Facebook: www.facebook.com/groups/cryptocurrently
Join UPcoin! Their beta will be publicly open very soon with live trading to follow: upcoin.com/?ID=f4c89a77
Posts are not financial advice, only the opinion of the author.
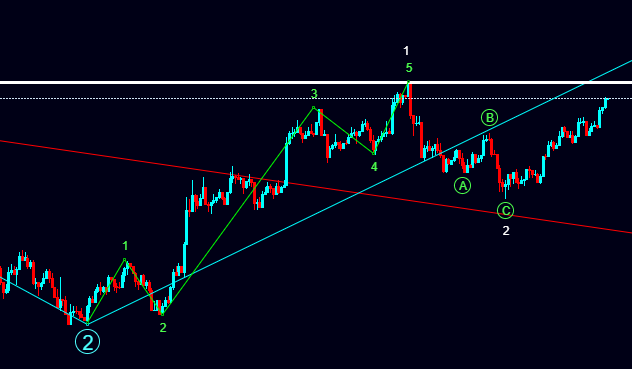
Where is the subwave 5 from your wave 1? We are now goin up to subwave 5 from wave 1
Already changed my colors since posting this but this is my count for subwaves 1 and 2 of wave 3.