Bitcoin BTC - Is A Breakout Imminent As US Stocks Come Under Pressure?
In the last 24 hours trading we have seen an across the board selling for Crypto's. You can see from the chart below that it effected some of the major Crypto's.
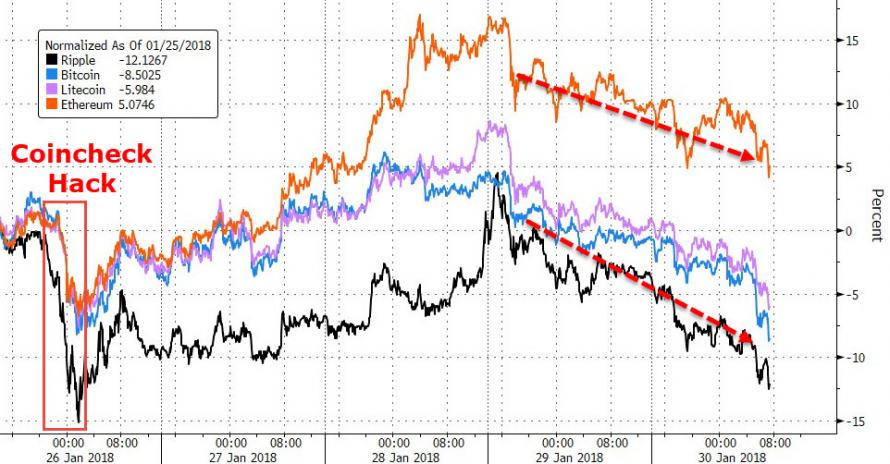
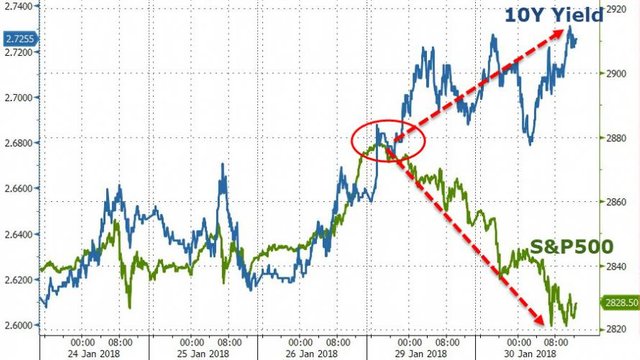
The selling overnight was predominately caused by a sudden bout of selling in US stocks as higher interest rates from US Government 10 year Bond yields finally was too much for stocks to ignore. (See chart below)
Bitcoin Daily Chart
With current trading already started for Wednesday in the Asia region we see that Bitcoin has come under further selling pressure as the price action indicates a breakout of support from the USD$10,200 level as indicated from the circle on the price action.
Its still early on a daily chart to come to any conclusions as this may be a false breakout and we could see this become a double bottom which would be bullish for Bitcoin for the short to medium term.
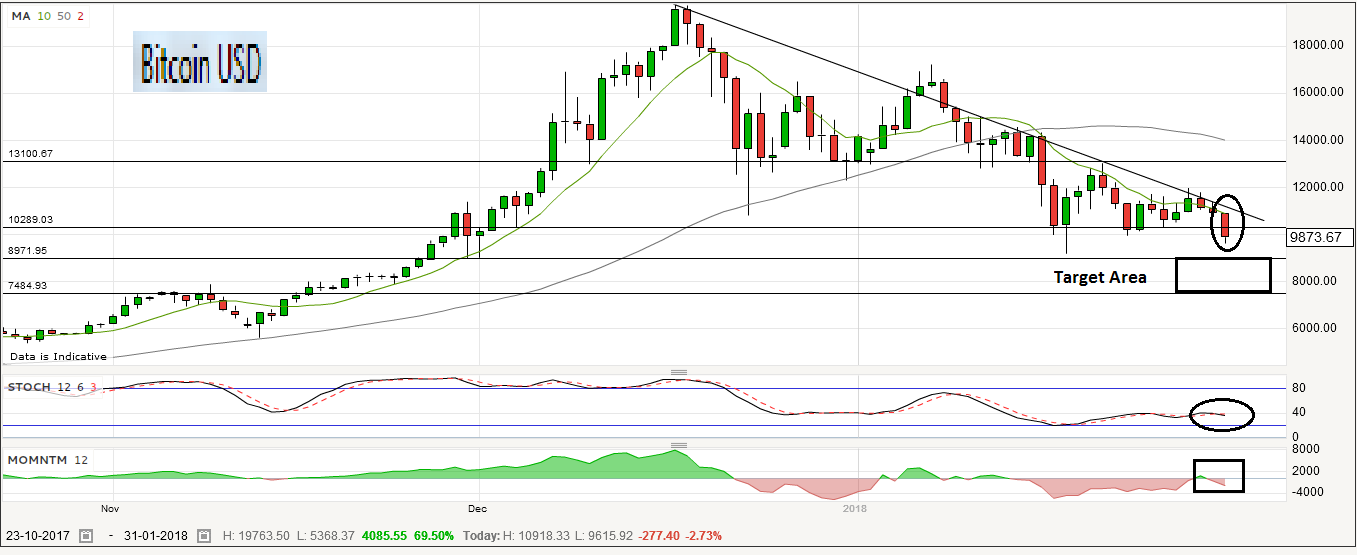
The other technical indicators for the daily chart are indicating that further selling pressure is ahead with both momentum down and currently in the red zone, as well as the stochastic has turned down to form a bearish cross pattern.
So the probability for a reversal presently is low with the current chart technical.
If the breakout is confirmed the target area based on the next 2 support lines are between USD $7,500 - $9,000 range in price.
Weekly Chart
Taking a look at the longer term set up for Bitcoin shows a similar pattern to the daily chart bearishness with a number of bearish indicators present.
The most interesting indicator occurred 3 weeks when the price action on the weekly chart closed below the 10 week moving average (green line) which has not occurred since September 2017.
However each close below the 10 week moving average in 2017 resulted in the price action to close back above the 10 week moving average the following week. As you can see from the chart this has not occurred with a follow up in selling continuing.
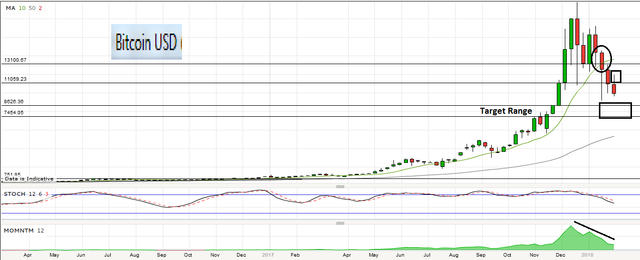
The one bullish point for the weekly chart is that momentum is still in the green however the trend is down which gives some hope for the medium term for a potential bounce.
The stochastic has been in a bearish cross for some time now and is falling suggesting there could still be a number of weeks of further selling to go.
The price action on the weekly chart shows that the support level of around $11,000 has also been broken 2 weeks ago.
Now that the break of support is confirmed on the weekly chart the next level of support range is between USD $7,500 - $8,600 level.
Thanks for viewing this post.

Remember a trader doesn't care about the direction of the trade only that they follow the trend - Happy Trading
Charts provided by
Zerohedge
Ig Markets
Disclaimer: This post is for educational purposes only, and all the information contained within this post is not to be considered as advice or a recommendation of any kind. If you require advice or assistance please seek a licensed professional who can provide these services.
Click the links below to view my latest Steemit posts:
Trading Update - AUD/NZD Breakout Confirmed
Forex - AUD/NZD Trading Update - Is This Trade About To Take Off
Bitcoin About To Breach Its Current Support Line
Netflix Smashes Expectations & Soars To Record Highs - But What About The Cash Burn?
I like how you follow cryptos, stocks, and forex. Your analysis was very thorough and I noticed the same thing about interest rates. Check out my blog for my own insight into the markets. I try to post daily updates on the stock market and occasional updates on other asset classes especially cryptos.
Thanks for your feed back. Ive noticed so far there is limited amount of posts on macro & stocks but mainly cryptos so its great you follow all markets and post this on your blog.
Congratulations @crushthemarket! You have completed some achievement on Steemit and have been rewarded with new badge(s) :
Click on any badge to view your own Board of Honor on SteemitBoard.
For more information about SteemitBoard, click here
If you no longer want to receive notifications, reply to this comment with the word
STOP