Bitcoin Price Analysis
Bitstamp 1-Hour and 1-Day Candle Charts
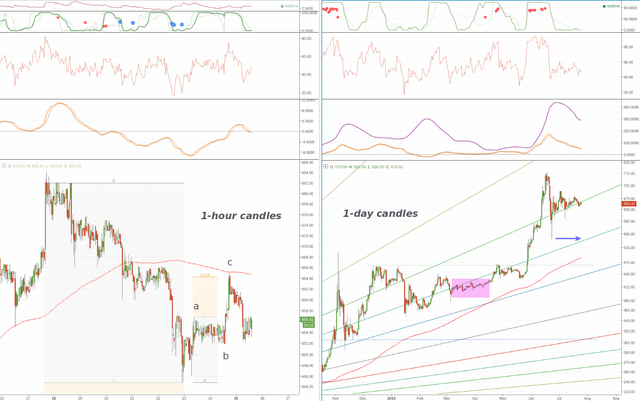
From the analysis pages of xbt.social, earlier today: An ABC corrective pattern was anticipated in yesterday’s analysis: If this wave count is correct, then we’d expect the wave C to target the 1.618 Fib extension of wave A at $664. This will also be the approximate level of the 1hr 200MA, as well as a 50% retracement of the decline since 18 July. The C wave did indeed target the 200MA across exchange charts and reached $665 in the Bitstamp chart before reversing (1hr chart, left). From the current juncture, the decline implied by the 4-hour chart (not shown) and 1-day candle chart (right) can resume. The 4-hour candle chart’s MACD, earlier today, crossed below its signal line while below zero. Meanwhile, in the 1-day candle chart (right), MACD has consistently held below its signal line since the June wave top. The present daily candle is critical for trend: it is below a Fib line that had seen strong downside unfold when correcting patterns closed a daily candle below it on two previous occasions. However, today’s daily candle has not yet closed and bullish conviction can close it above the Fib and potentially neutralize all of the large timeframe bearish signals. In this case it is conceivable that the market maintains strain against decline until a gradual rising wave is achieved – as was, perhaps miraculously, managed earlier this year in the magenta rectangle.