Bitcoin Technical Analysis - 1/12/17 - Up or Down?
The market has been wild this year, setting new highs, and now being amidst a crash.
I thought it might be good to take a look at some of the trends in place, in order to try to quantify the likelihood and magnitude of another downturn. (This is written from the 1/12/17 perspective of having set a bottom at Bitfinex at 735.26)
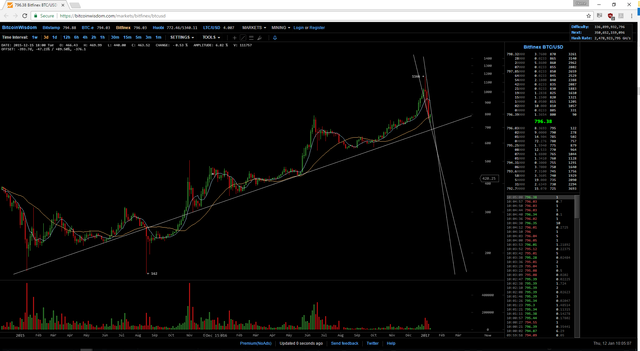
The first chart I'd like to show illustrates an ascending line of support, in place for about a year:

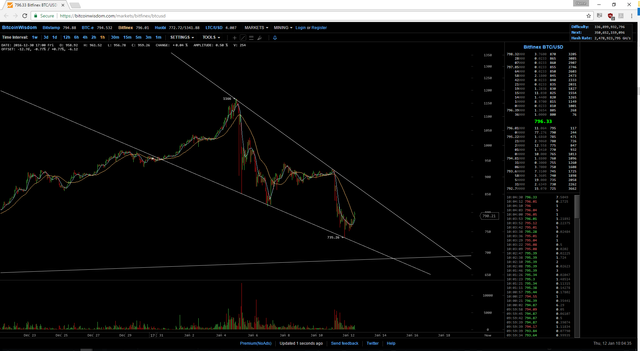
Next I'd like to look at the 15m to show that while volatility has been high, movement has been constrained to a well-defined range:

Eventually, these two patterns must converge. You can see that the support line will force the descending wedge to terminate 'early', or before its own support and resistance lines converge. By these lines, that decision can be put off, at maximum, until 1/18 at 14:00 CST.
Typically, Descending Wedges are reversal patterns.
Putting this all together, I speculate that we have one final leg down, constrained by both the wedge and support.
If these hold, then the lowest low would be $686.
What do you think will happen? Are there any technical indicators I've left out that warrant a second look? Comment below - I'll do my best to reply to all comments.
Follow me if you've found this helpful - with the market heating up I expect to be posting more daily analysis.
Standard disclaimers apply - none of this is trading advice, you are responsible for your own decisions, etc.
-Chainsaw
A fellow BitcoinTalk member has created a free bitcoin trading simulator. It's a great way to get a feel for Bitcoin's trading behavior without having to put real money on the line.
You sign up and receive $100 in play money. You are always either all-in, or all-out. Trades cost 0.2% commission, limit orders cost 0.15% commission (of your fake money).
There is a leaderboard...whose rankings have been changing quite rapidly amidst all this volatility!
Here's the link:
http://www.bit-sim.trade/
Hope to see you all there - I'm Chainsaw ;-)
An example of how playing the game helped inform my real life trading decisions.
About a week ago, one BitcoinTalk member called for a drop to $660, while we were still well above $1000. Nobody believed him. Within bit-sim.trade, he was the only player in the top 20 to be in a cash position.
As the corrections unfolded, his rating shot up to the top 5.
This particular case served as a case study of being greedy when others are fearful, and fearful when others are greedy. The more contrarian the view, the greater the potential rewards. In my view, simply seeing that the market was so overconfident, helped inform my real life bitcoin trading decisions. (In this case I sold some GBTC in the 120s, with the intention to rebuy lower.)
Simply getting a snapshot at market sentiment as valuable, whether you are personally using it as an indicator or a contrarian indicator.