Bitcoin Cash Price Technical Analysis – BCH/USD to Correct Lower

Key Points
- Bitcoin cash price after trading as high as $1754 started a downside correction against the US Dollar.
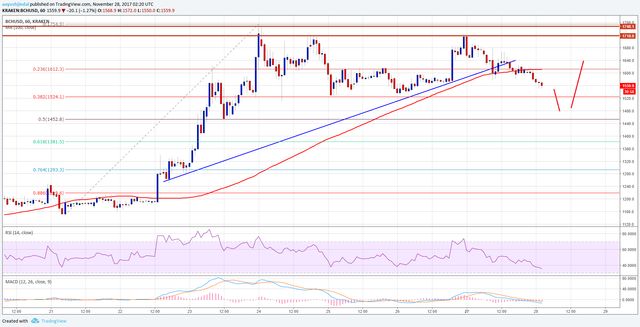
- Yesterday’s highlighted major bullish trend line with support at $1635 was broken on the hourly chart of BCH/USD (data feed from Kraken).
- The price is now correcting lower and it might soon test the $1450 support area.
Bitcoin cash price has started a downside correction towards $1450 against the US Dollar. BCH/USD might recover once the current correction is over.
Bitcoin Cash Price Resistance
It seems like buyers struggled to push bitcoin cash price above the $1700 level against the US Dollar. The price made a couple of attempts to break the $1718 and $1750 resistance levels, but failed. As a result, a downside correction was initiated. It is now below the 23.6% Fib retracement level of the last leg up from the $1148 low to $1754 high. More importantly, the price is now below the $1640 support and the 100 hourly simple moving average.During the downside move, yesterday’s highlighted major bullish trend line with support at $1635 was broken on the hourly chart of BCH/USD. The pair will soon test the 38.2% Fib retracement level of the last leg up from the $1148 low to $1754 high. However, there are chances that the pair might even break $1500 for a test of the $1450 support area. The mentioned $1450 support is close to the 50% Fib retracement level of the last leg up from the $1148 low to $1754 high.

Therefore, the current correction might find support near the $1450 level. On the upside, the broken support at $1640-1650 is likely to act as a resistance along with the 100 hourly simple moving average.Looking at the technical indicators:Hourly MACD – The MACD for BCH/USD is now in the bullish zone.Hourly RSI (Relative Strength Index) – The RSI for BCH/USD is heading lower towards the 30 level.Major Support Level – $1450Major Resistance Level – $1640
Charts courtesy – Tradingview kraken
Source: Nesbtc