Bitcoin past and future price actions
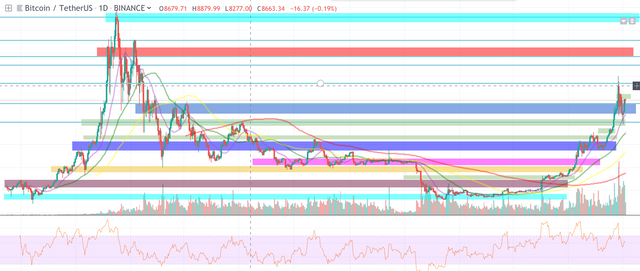
It's not all that completely random if you look at the price actions. There's strip or zones where it bounces back and forth, tries to test support and resistance. Sometimes it can be erratic. It's like tracking a macro-economic trend.


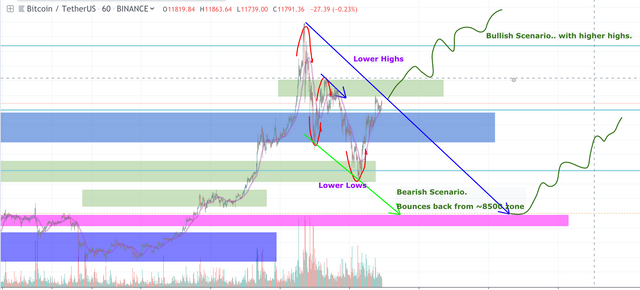
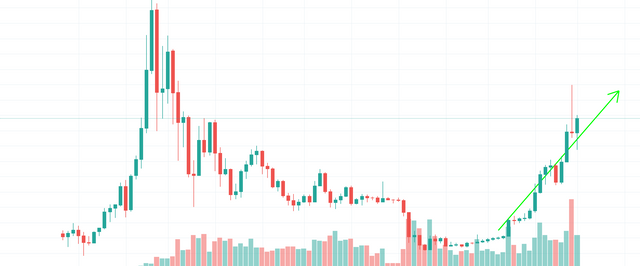
After the bull run up to 14K, now it's short term bearish, as it's forming lower highs and lower lows (2nd chart). But on a weekly basis(3rd chart), we are clearly on a bull market after the previous bear market ended in this summer. Bitcoin will most likely shoot a new record high (above 20K), conservatively speaking, by the beginning of next year (or early with another parabolic run). And in long term, bitcoin price will shoot 100K when bitcoin supply halvening happens by 2021 with the entrance of all the institutional investors.
https://www.ccn.com/crypto/why-bitcoin-price-smash-100k-before-2022/2019/06/25/
