Bitcoin technical analysis 23.7.2018
Howdy guys
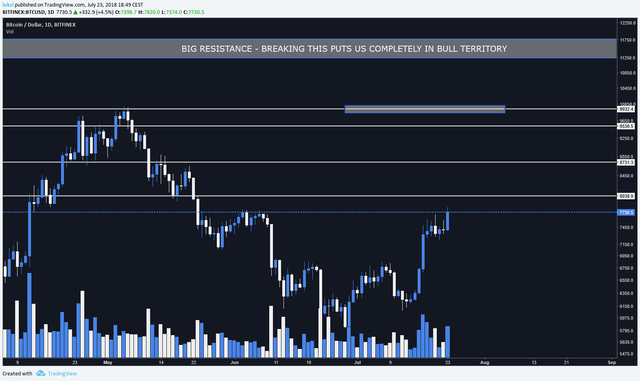
It's been a good week for bitcoin, we so an increase of 1000$ roughly in price with a weekly close at 7400 which i consider extremely bullish. Also the target of inverse head and shoulders was hit (7700). So what's next?
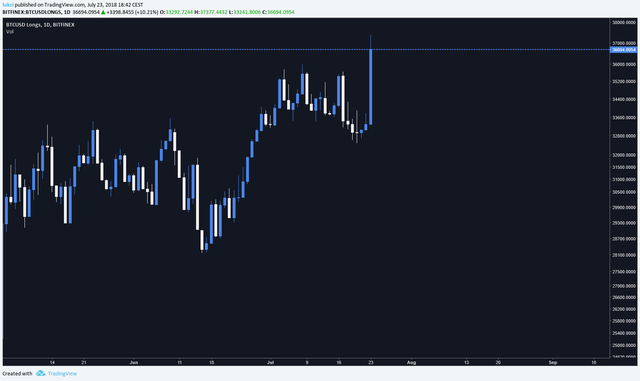
We're still overbought on bigger timeframes however there's still room to go up. What concerns me is the number of longs opened up in the last few days:

This is a dangerous area for opening up a long and we could be in for a long squeeze. That would push price down a bit. So there are currently 2 scenarios:
1.) Bullish - Btc pushes through 7800 and we go to 8200,8300 before retracing (that reject at 7777 was not hard reject at all so it might give another try or 2)
2.) Bearish - This is the top right now and we pullback to at least 7450-500 if not 7250 before continuing up.
I'm currently flat and would not advise you a position right now, if anything i'd rather short here even though indicators are still bullish.
i've highlighted some resistances along the way up.

of course there's still 7800 we have to go pass.
Ty for reading