How to Make Money Trading Bitcoin! (Part 2)

How to Make Money Trading Bitcoin (Part2)
Incase you missed part 1 here is a link: https://steemit.com/bitcoin/@bitwithblake/how-to-make-money-trading-bitcoin-part-1
Alright, let's get started. So in part 1 we looked at how to read charts. in part 2 we are going to continue down that path of charts but show what more charts can do. By using indicators. We will be covering 4 of the most common and basic indicators. There are many, many, many more, but these will give you a nice base.
MA (Moving Average) / EMA (Exponential Moving Average)
MACD (Moving Average Convergence Divergence)
SAR (Stop and Reversal)
RSI (Relative Strength Index)
I have chosen these for three reasons. They are all very common, they vary greatly in what they can tell you and they are all on Bitcoinwisdom.com
MA (Moving Average) / EMA (Exponential Moving Average)
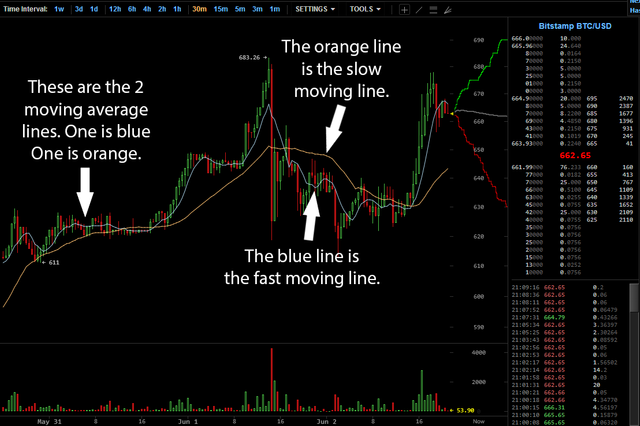
Moving Averages, are exactly what the name implies, they are “moving averages”. A simple way to explain it is they smooth out the price fluctuations over time. How they work is they take the average closing price over a certain amount of time (which is changeable). This allows you to see more clearly what is happening to the price over a period of time thus creating an easier way to see the potential direction of the market. Because it's an average that needs inputs to calculate it generally moves slower and less dramatic than the actual price. Normally when using MA or EMA there are two or more lines. These lines each have different parameters to show the price average. Generally speaking, when these two lines cross most traders buy or sell, depending on which way the trend is going.
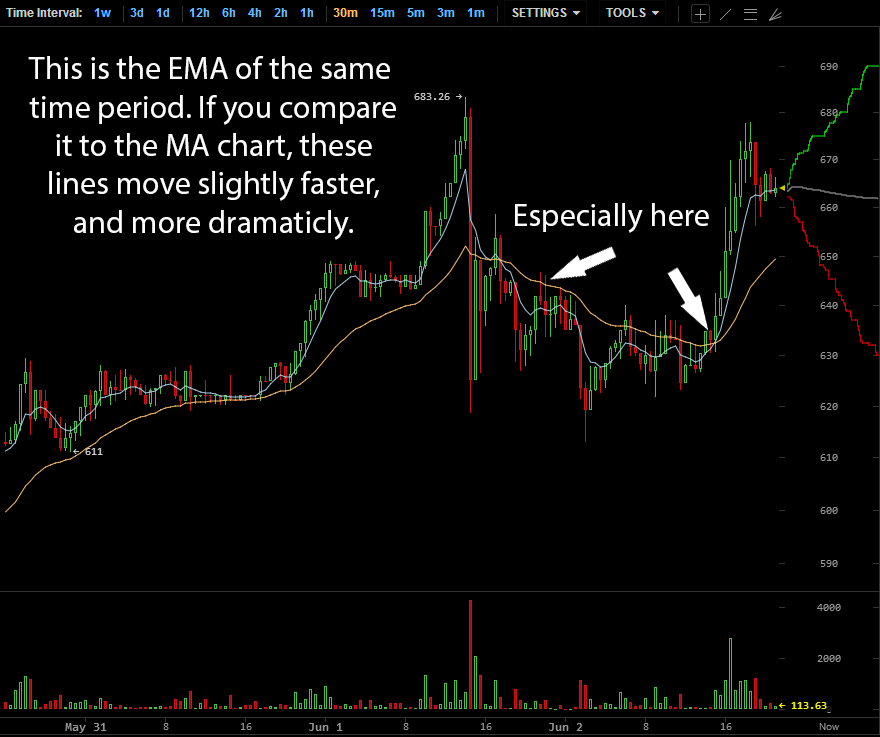
Exponential Moving Averages, Picture here, are the same as regular Moving Averages except they react quicker to what the market is doing, which could be good and bad. They change more rapidly, allowing you to see a trend forming faster than you would with a regular Moving Average. That means you can buy or sell quicker and take the most of the opportunity. However, because they move quicker they also make mistakes. They could lead you to buy or sell into a false signal.
Deciding on which one to use is like picking which child you love the most, you can't. But they both have pros and cons that when used together can create miraculous results.
MACD (Moving Average Convergence Divergence)
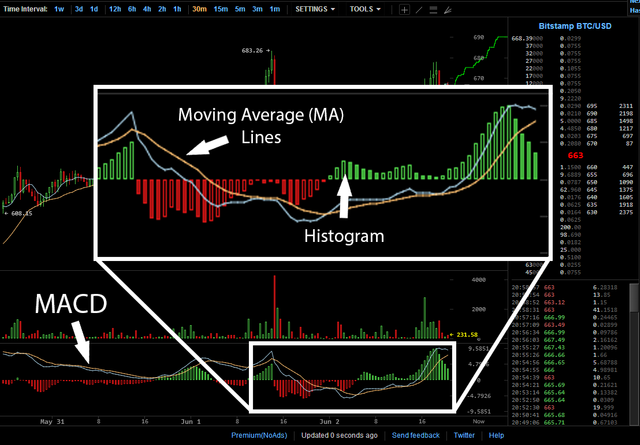
MACD, is a great indicator to tell if a trend is starting, normally way before the MA or EMA will tell you one is. This allows you to get that extra jump you need to ride the trend longer. But be wary, just because it's moving doesn't mean the price is.
A MACD indicator has three important indicators rolled into one. There are two moving averages, a slow and a fast one, also there is a histogram. The moving averages are just like the ones mentioned before, except the almost always move faster (but you can change the parameters). The histogram shows the difference between the two moving averages. The farther apart the moving averages are the bigger the histogram is. When the histogram is trending down this is a good indication that the price will also begin trending down. Although, it could also work the other way. When the Histogram is trending up it is a good indication that the price will also trend up. But not always, so pay attention. A word to the wise, when the two moving averages on the MACD cross, the histogram will always be at zero (or in the center of the line).
SAR (Stop and Reversal)
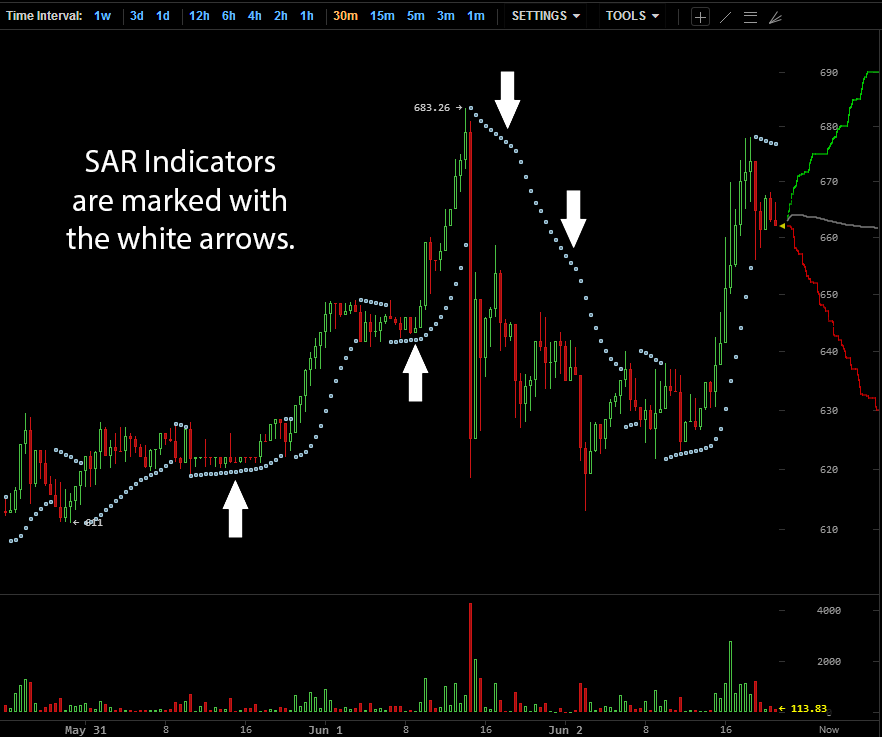
My favorite thing about the SAR, indicator is it is so simple even your cat can use it. Stop and Reversal literally means the trend has stopped and is reversing the other way. When the dots are below the candlesticks: buy. When the dots are above the candlesticks: sell. That simple. Personally, I only use this to confirm my suspicions about what the market is doing. There is an Achilles tendon though, it is horrible in a sideways market (when the candlesticks are flat), you will only lose money, I promise you.
RSI (Relative Strength Index)
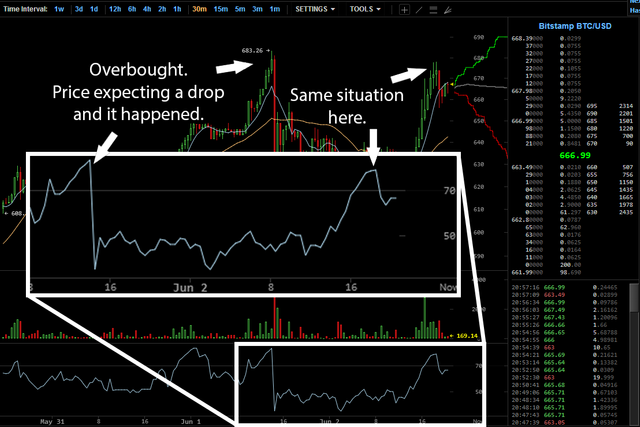
The RSI, Picture here, is an identifier that can tell you if the market is oversold or overbought. The RSI reads on a scale from 0 to 100. If the line is below 30, you can easily assume that too many people sold and the price will start to come up. If the line is above 70, too many people bought and the price will surely come down. The big question is how much, that is something that this indicator cannot tell you. But it can definitely help you see if a trend is on the way. If the RSI line is showing below center (50) for a while it is very probable the price will start trending up.
Hi, nice TA on bitcoin.
Thank you. More charts would be appreciated
this is great! thanks for the info Blake! very informative stuff! Will Resteem
!