Bitcoin Analysis: Diagonal Trendline Fakeout, $11,800 High Confirmed, How Low Can We Go?
Welcome back! I know its been over a week, but I hope you didn’t think i had forgotten about my promise to update you all on the #Bitcoin outlook as the markets kept developing.
In my last article, I spoke about not being fooled by this rise as the market being bullish and not wanting to be bullish until my very strong resistance level of $12,300 was broken, I went on to say,
“To someone who does not have a trading plan or a strategy in mind, they will always be fooled by up moves like these and begin thinking that the tide has turned and their investment will begin to rise. It is very easy to get lost in the price action movements on any asset class, specially when you are checking your phone every 5 minutes or constantly throughout the day like most people do”
This quote is specially true because in a market where so many people are new to technical analysis and a rumor can be easily spread, in this case an analysis, its important to have an educated way to assessing if the information is credible or not. To be fair on my last analysis i did have the $11,300 level being the resistance which we would come back to, but instead we went a few hundred dollars deeper and ended up finding resistance back at the initial resistance zone i had marked on my first article written on the 21st of February!
I am not used to such deep retracements which is why i do not normally look for them but its seems in the crypto market they happens often so I will adjust and allow for that in the future. After all that’s what trading is all about, trying out new ideas, applying them and optimizing as you find something successful that suits your style of trading.
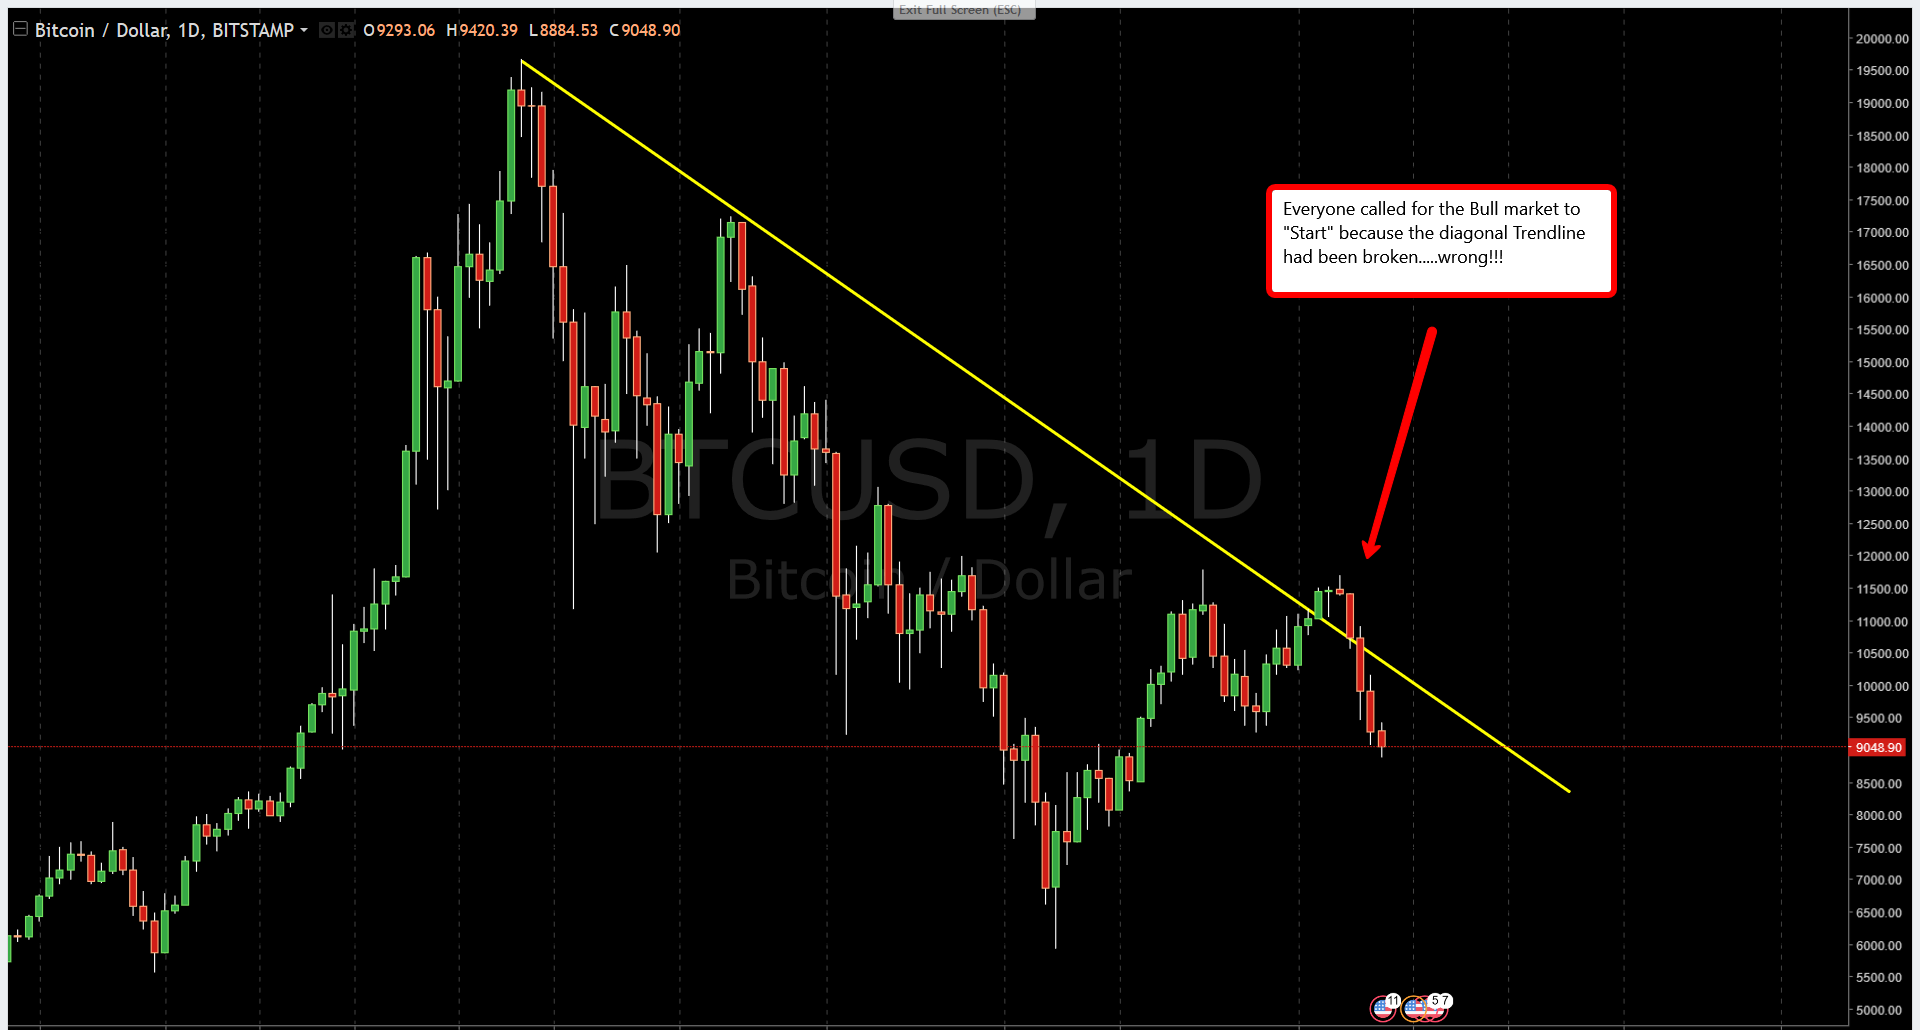
One thing that people need to get accustomed to in the markets, is that when everyone is agreeing with you that’s when you should be fearful and when they disagree that’s when you should be ready for success. Even when it seemed like the whole marketplace was convinced that since we had broken the diagonal trendline we would now have the massive bull run we have all been waiting for, I was betting that they were all wrong and we would go lower again. You see, diagonal trendlines can be very deceiving, sometimes they work and sometimes they don’t. I have seen some successful traders use trendlines very accurately and sometimes the call will be right but the important part to remember is that smart money — those with large amounts of money in the marketplace — don’t just sit behind charts and decide to execute trades based on trendlines or chart patterns or even technical indicators. This is why i have a large problem when people solely use this method and add some sort of indicator, get a few calls right and suddenly become trading experts seemingly overnight. At Beyond The Hodl, our students are taught to think and act like “whales”, or smart money traders so they can fully take advantage of the markets and drastically raise the probabilities in their favor.

Now let us get to the part you all came here for, future targets and analysis.
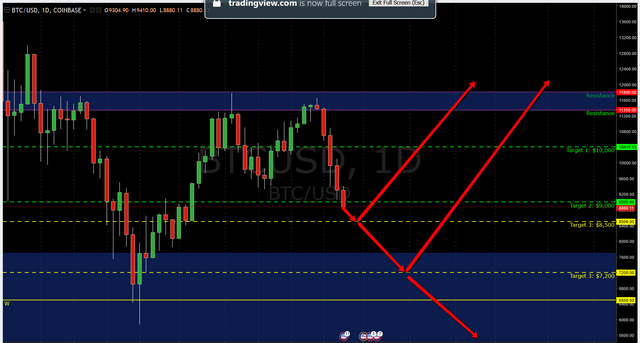
Ever since we hit the $11,800 – $11,350 zone again, we went on to hit 2 of the 4 targets that I called which are as follow:
Target 1: $10,000
Target 2: $9,000
Target 3: $8,500
Target 4: $7,200
At the time of writing this article #BTC is almost to our third target at a low of $8,800.
Below you can see the 3 different scenarios that could happen, but in my opinion bitcoin is looking really weak and might just go down one more time before rising. If we do end up making a new low we will not stop until we see $4,700 – $5,000 zone.

So stay tuned for any changes in my bias!
For more updates and information:
Make sure to subscribe or,
Follow us on Twitter (@beyondthehodl): https://twitter.com/beyondthehodl
Follow us on Instagram (@beyondthehodl): https://www.instagram.com/beyondthehodl/
Original Article: https://beyondthehodl.com/bitcoin-analysis-diagonal-trendline-fakeout-11-800-high-confirmed-how-low-can-we-go/