Bitcoin 14/04/18
Hi,
I think Bitcoin is following my bearish path I posted in the last blog. The recent surge in price is just a bull trap with a lot of Whales closing their short positions:

I mean look at this madness?!
Before I start I want to clarify that I am in no way a financial advisor and this blog is for educational purposes only.
1 ) Firstly, I am going to try and explain why we are still in a bear trend
a. Wave Structure
There are many different possible scenarios. I have changed my count slightly from my last post. I now see a double three forming after the big yellow impulse X wave. We get an extended flat corrective wave first, with wave B retracing almost 100% of wave A, followed by a long extended C wave. We then get an impulse wave up (marked in green) followed by another 3 wave corrective pattern.
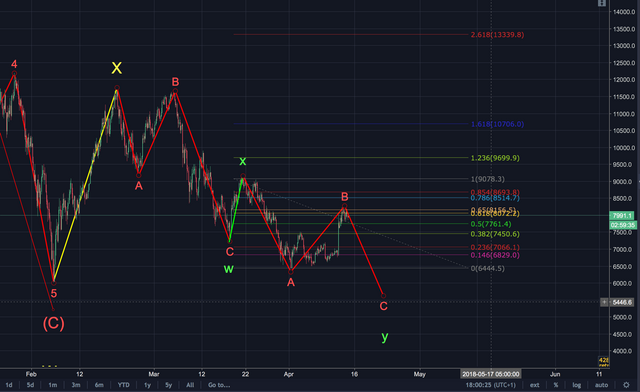
We can see that we are currently in wave B of the second corrective wave. The wave hit the golden pocket and thus broke the resistance line (will talk about the implications of this later on).
b. Stoch RSI
I like to use the Stoch RSI here, it shows a clear trend. BTC is dangerously overbought on the daily chart after the recent surge. Both the blue and the orange lines are hovering around 99, anything above 70 is considered overbought. I have highlighted overbought areas in the past and also marked their subsequent retracement.
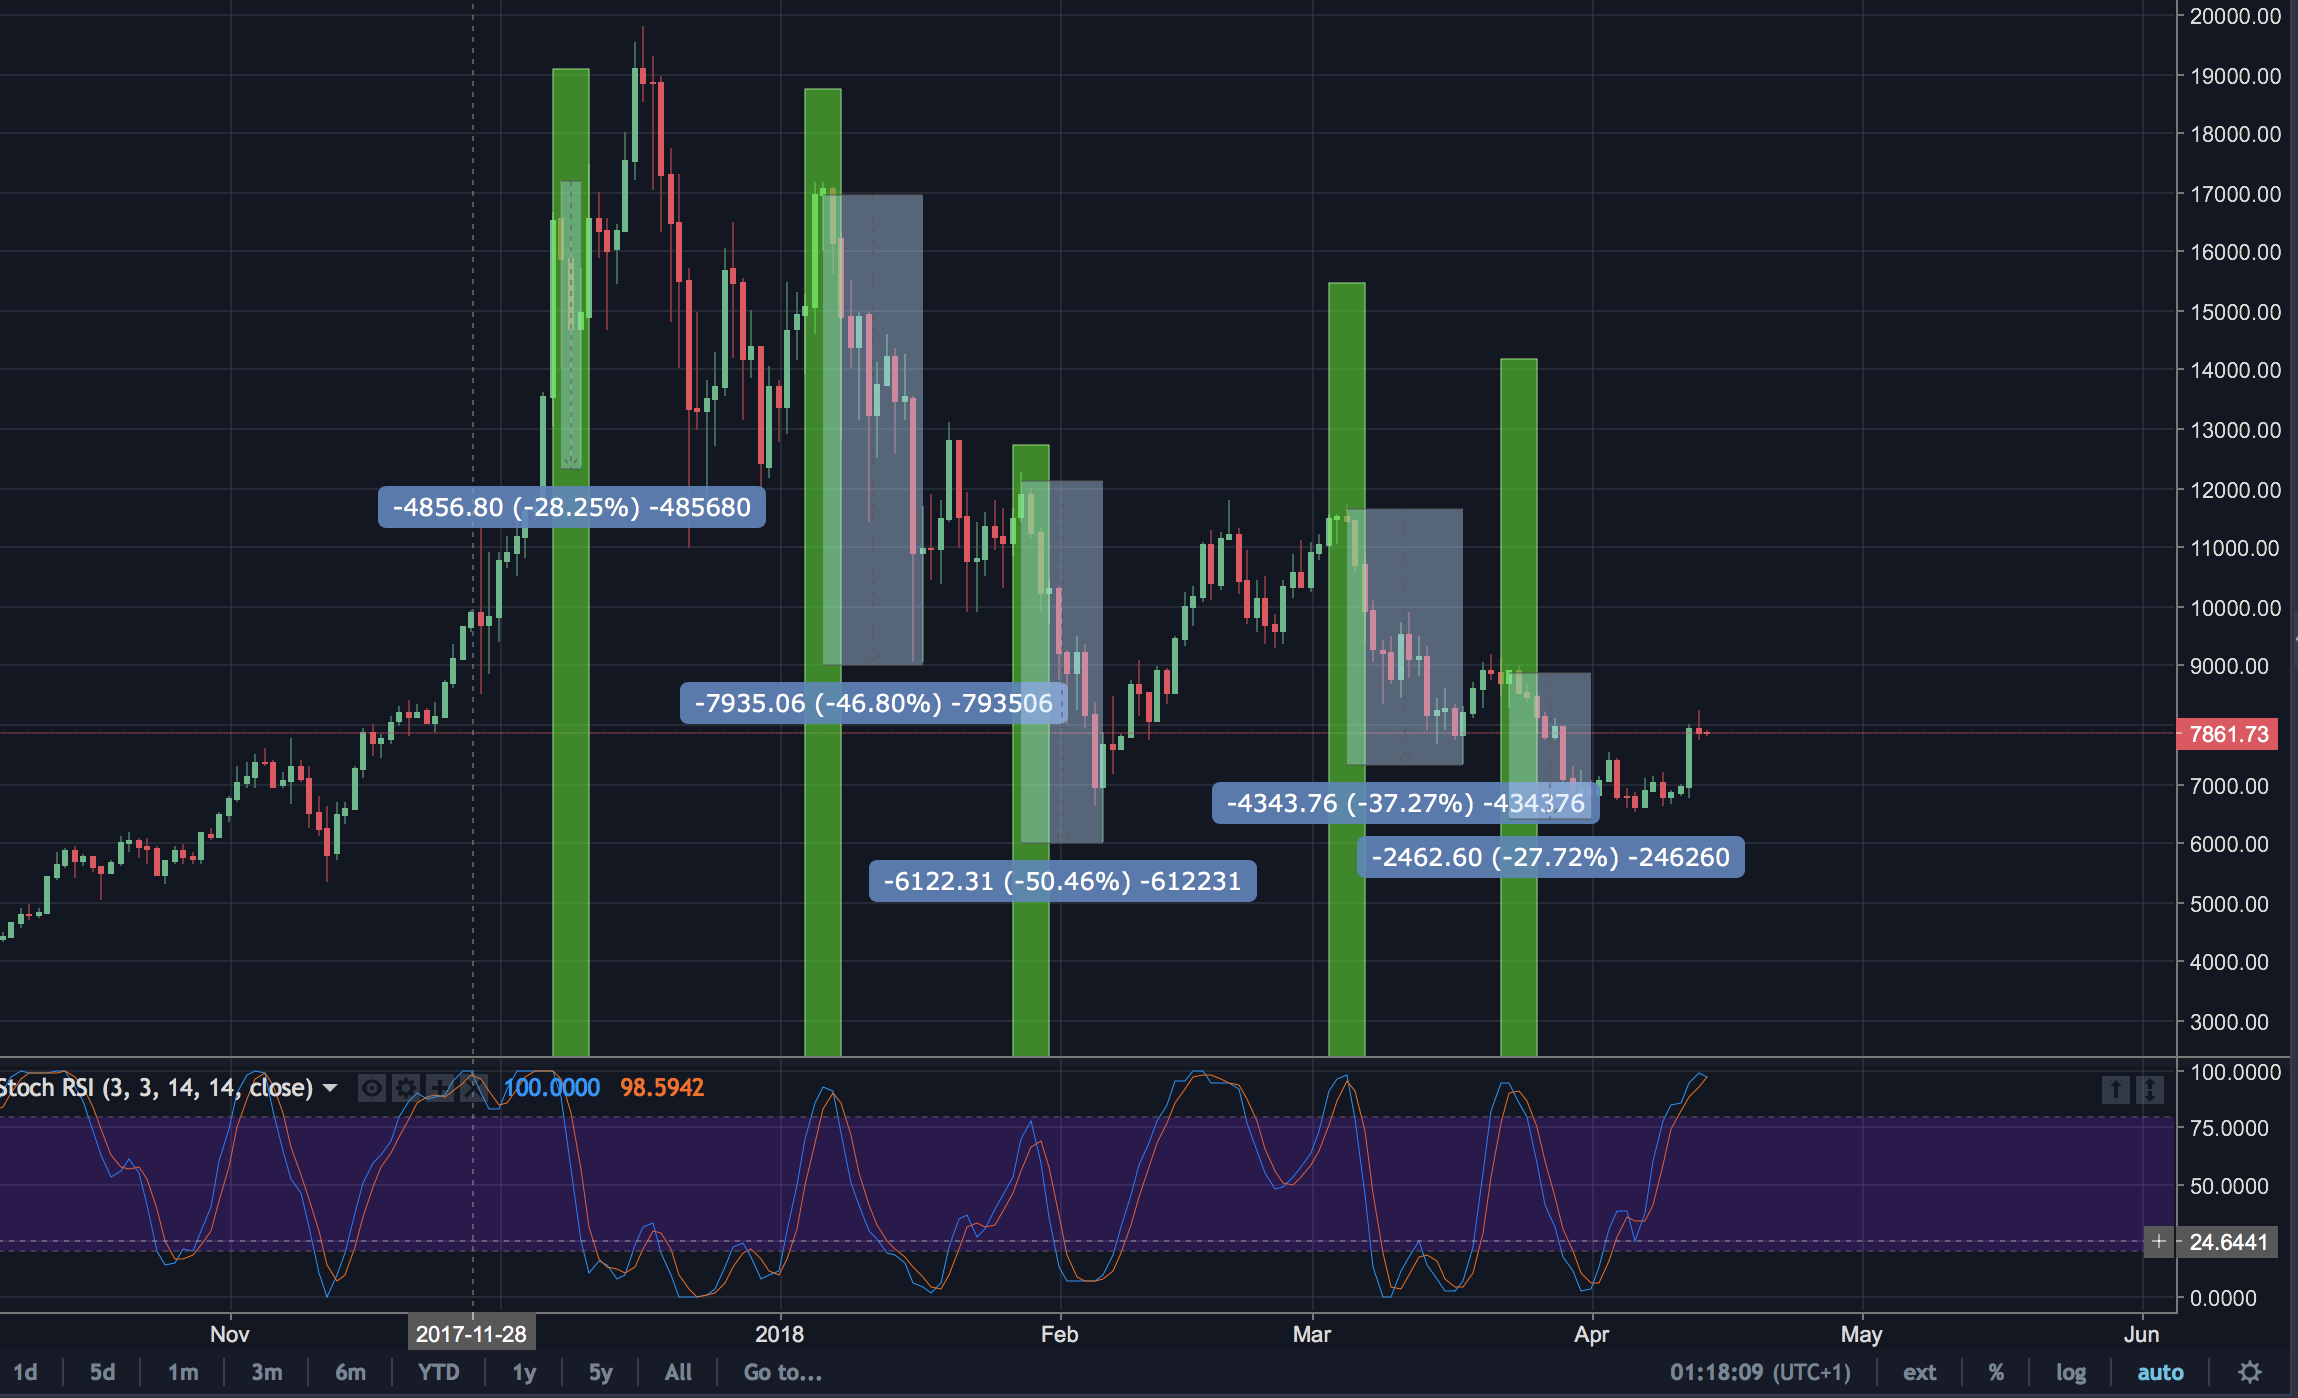
However on the 2HR and shorter charts we can see the Stoch RSI has bottomed so a small final push up might be attempted before carrying on back down.
c. Shorts vs Longs
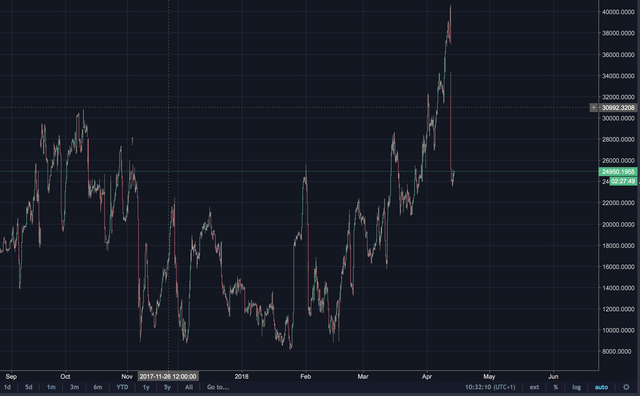
It was more due to the fact that people closed their shorts rather than more people went long that the price shot up. The graph below shows how many shorts closed:
Whereas look at how little the longs increased by:
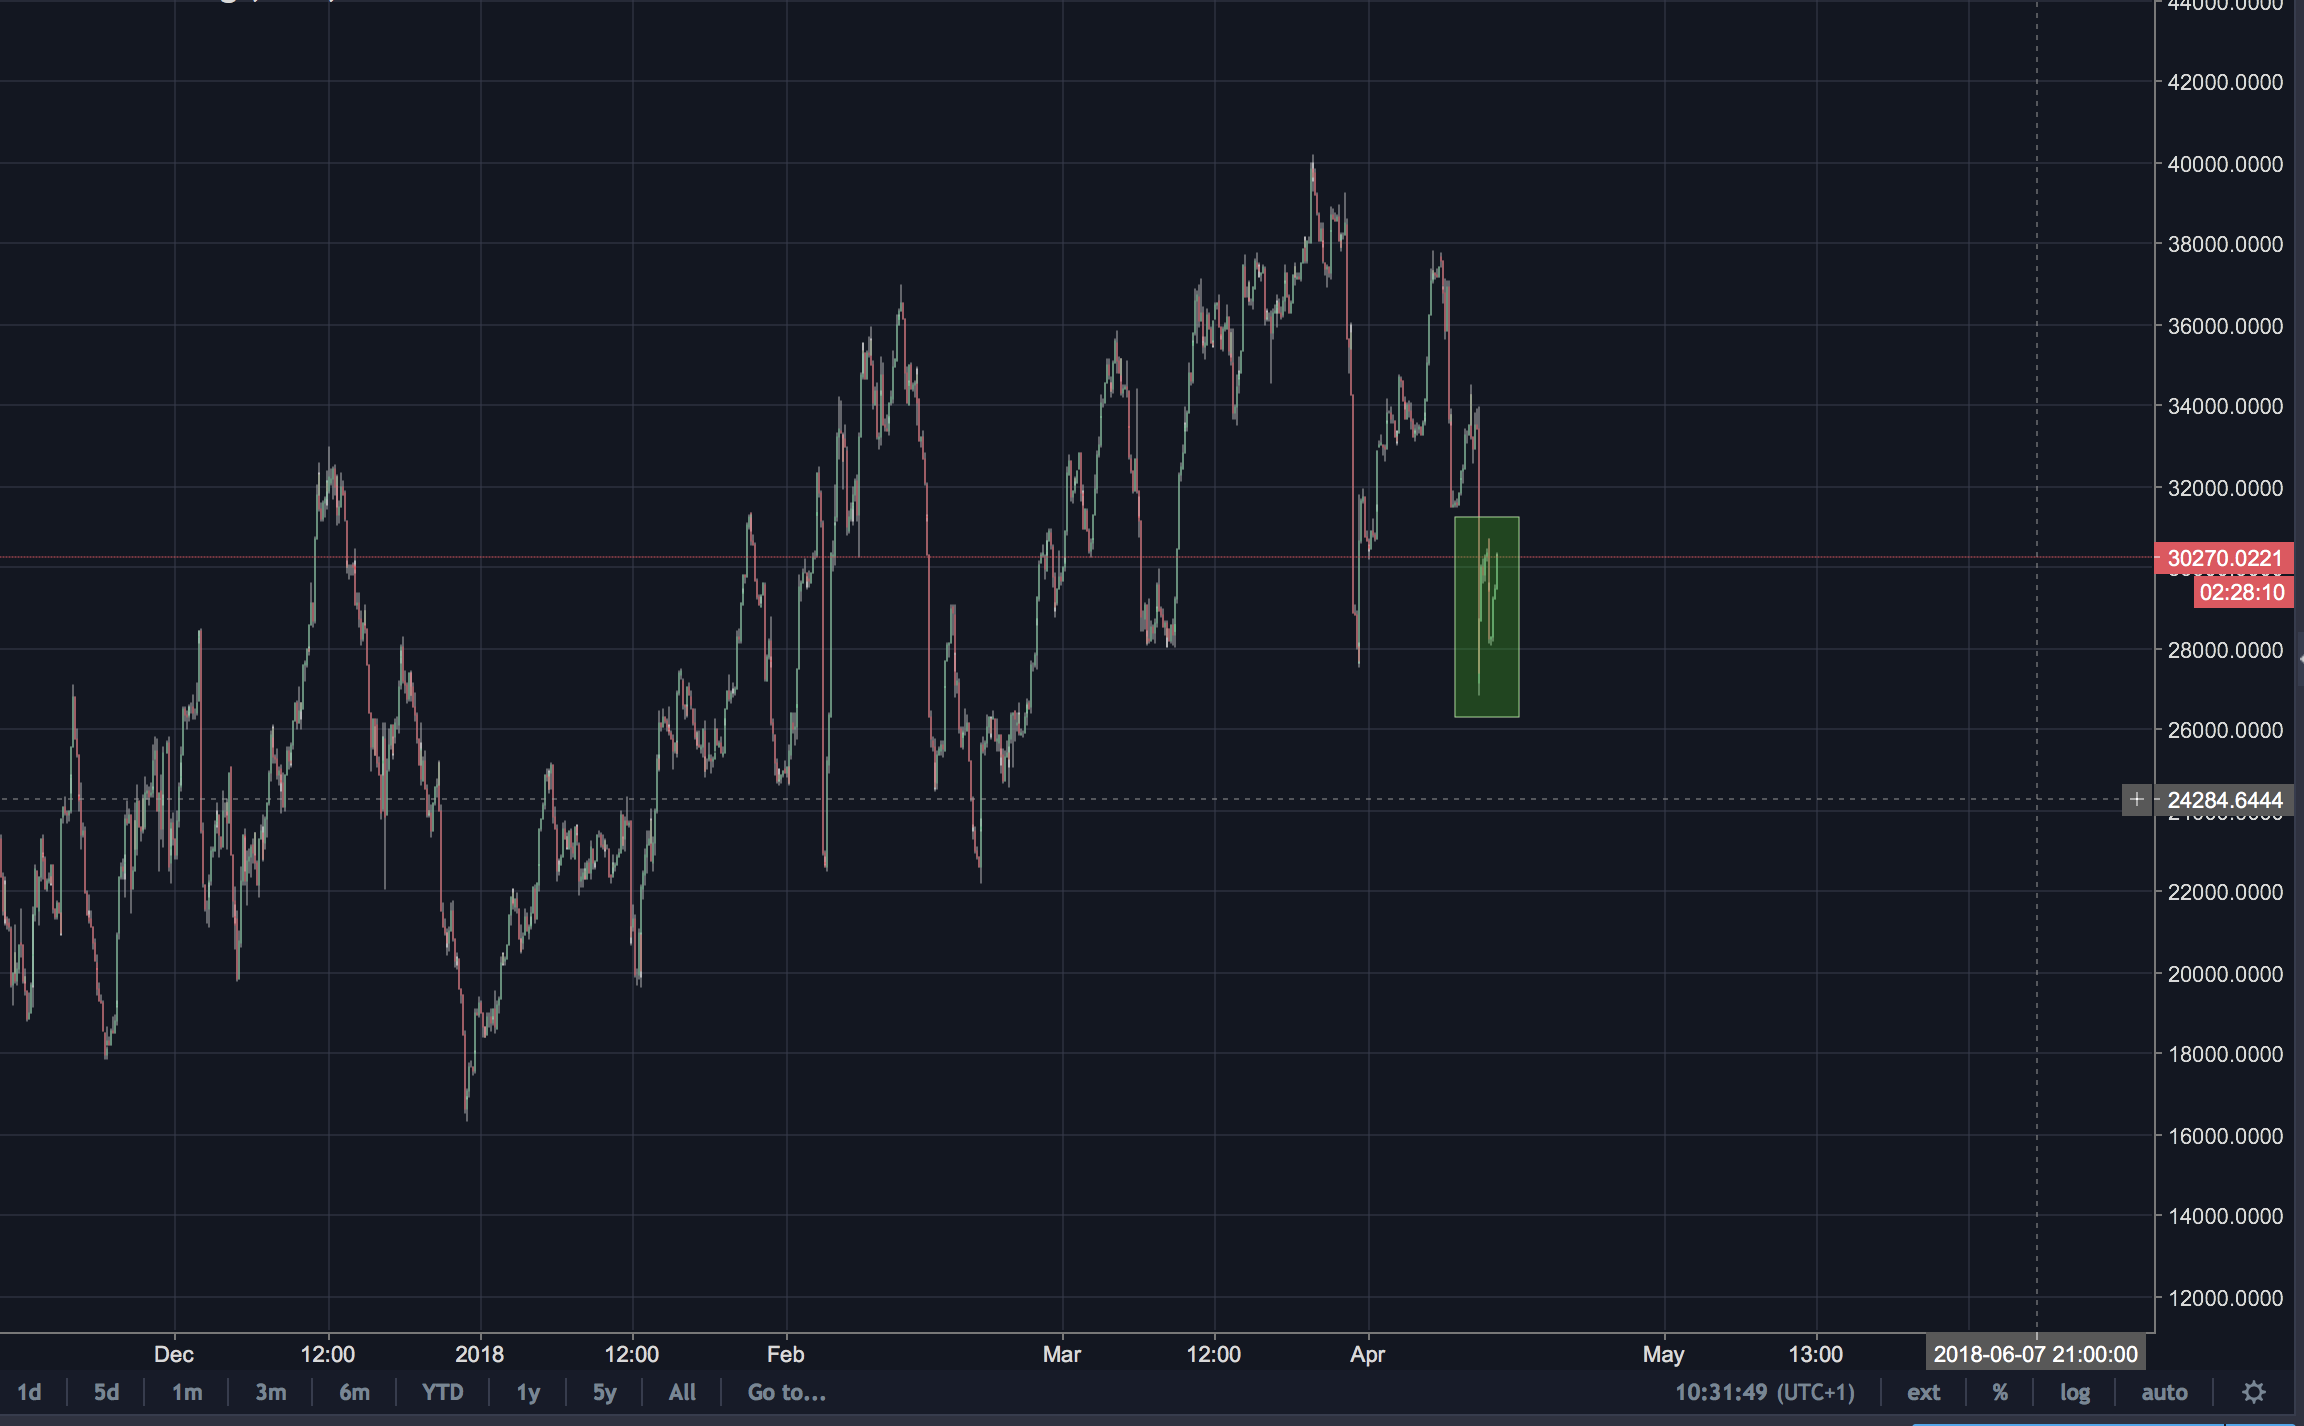
Unfortunately, the people who entered a long were most likely experiencing a bit of FOMO.
d. The first break of the resistance (insert Star Wars reference here)
Okay so earlier I mentioned how BTC had recently pushed up through the resistance line. However a small push through does not mean the reversal of a trend. This has happened before:
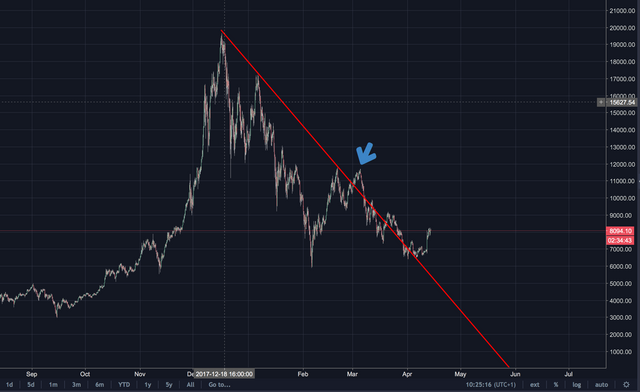
We can see that BTC broke out of the resistance line that we had first drawn, the line perfectly connects three of the highest peaks of the downtrend. However, even though it broke through the line (marked by the blue arrow) it still didn't take away from the fact that we were in a massive correction, after breaking out it crashed back down again and we had to redraw our line. Shown in the picture below:
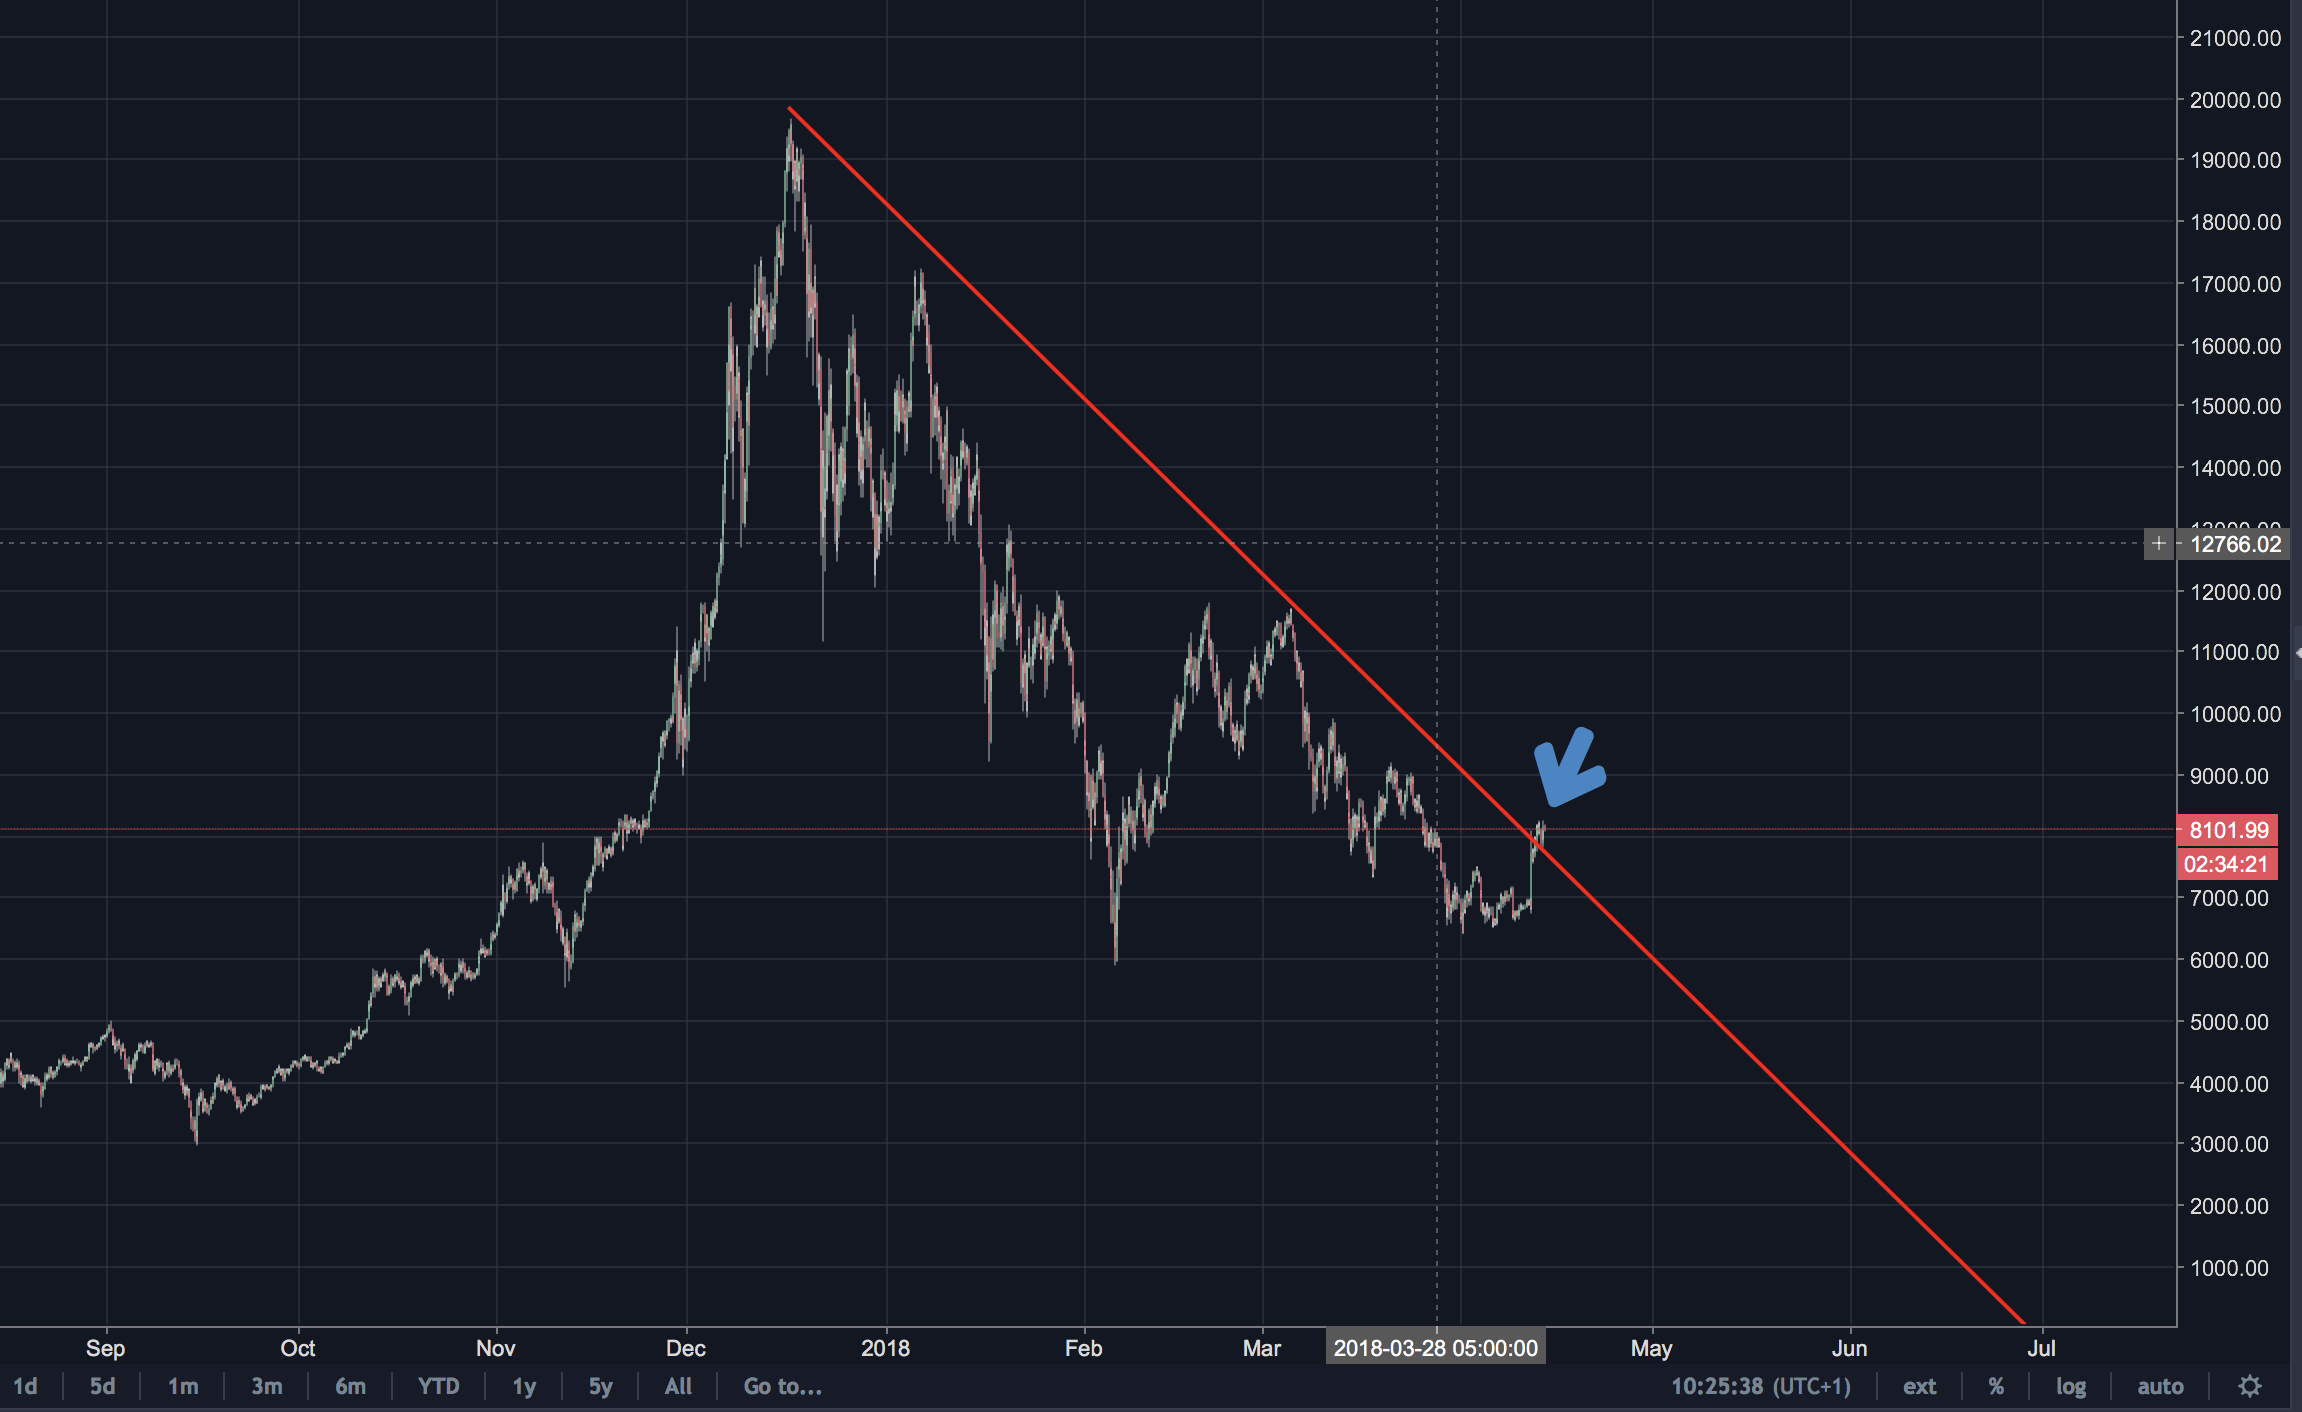
The new arrow points to where we have just broken out.
- CHALLENGES AHEAD
a. Resistance areas
BTC needs to push down past the green line of resistance that has held since mid July last year. We can see the two times BTC has bounced off this line before going off parabolic and crashing back down to the line for its first touch on 06/02/18. It has been hovering around the line for the past week before this big push.
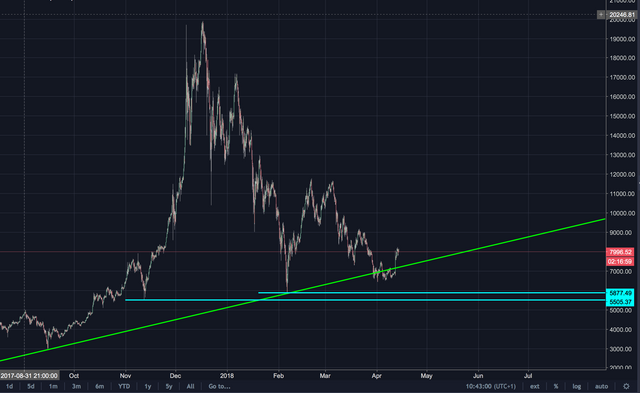
The two horizontal lines (in blue) mark two price points that have previously supported a bounce. The $5900 mark will be a key region of support and if this is broken BTC will plunge (mainly due to psychological factors - it's the last major stand point for bulls), watch for bounces off both these lines.
Happy trading!