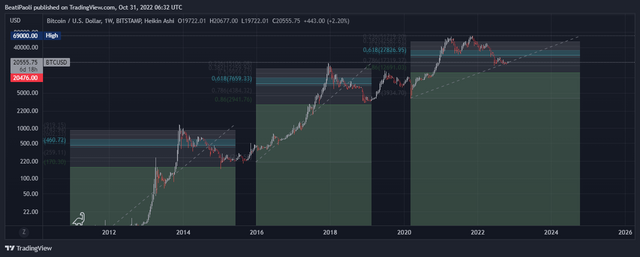
0.86 Fib. retracement level , and what it means for Bitcoin
Hello ,
We could see that historically , the bottom for BTC is below 0.786 and usually almost touching 0.86 Fibonacci retracement level. / from the previous bottom to the last top/ . ( Weekly chart)
The fib. 0.786 and 0.86 levels are often a bottom for bigger corrections , not only in the crypto market.
Then breaking upwards the fib. "golden pocket" 0.618 level is a confirmation for the next bull run. In that case that is 28K fo BTC.
Buying below 0.786 fib. is one of the best opportunities EVER.
*A lot of indicators have already shown that the bottom is in .
