How to trade successfully using only candlesticks!
Ok, After trying out many expert advisors and strategies, I decided to get back to what many traders consider basic TRADING STRATEGY that involves only candlesticks. Well, at this point, I'm assuming nearly every trader has some knowledge of major candle pattern interpretations, therefore, I'll quickly go over the most popular candle patterns.
Engulfing Pattern - When a small candle is followed by a relatively large candle that completely wraps its body (shadows are not necessary). For a bullish engulfing pattern, a small black candle is engulfed by a large white candle. The reverse is bearish engulfing where a small white candle is completely engulged by a large black candle. In my experience, engulfing pattern is the most reliable among all candle combinations!
Hammer (Hanging Man) - A small real body that has a very long lower shadow with little to no upper shadow. Traditionally, traders like to call this pattern a pin bar, but I think it's a wrong term since hanging man should precede an uptrend, hammer always emerges in downtrends but traders take any candle with long shadows as pin bars with no regard to the trend.
Doji - A candlestick that has no real body. During uptrends, emergence of a doji candle followed by lower closing means bears have taken control of the market. The same goes for downtrends, but only in reverse. My observations show doji combinations are second most reliable candlestick patterns after engulfing patterns.
Of course, there are many other combinations such as dark cloud covers, inverted hammers, stars, spinning tops, etc. but for the sake of simplicity, I do not trade the remaining combinations es frequently as the ones I mentioned above.
Now the most important part ...
Never trade candlestick patterns that emerge against the direction of the trend you are following. Trade them only when they emerge at retracements.
That means, in uptrends, you don't want to sell if you see bearish engulfing or hanging man at the top while bullish engulfing candle would not warrant buying once it emerges in a downtrend.
Now, how do we know if the retracement is close to termination? - We simply don't. The only way to know this is to apply some common sense and use fibonacci percentages, most commonly 50% and 61.8% ratios. If you see the aforementioned candle combinations around these percentages, you have high chance of catching an excellent entry level.
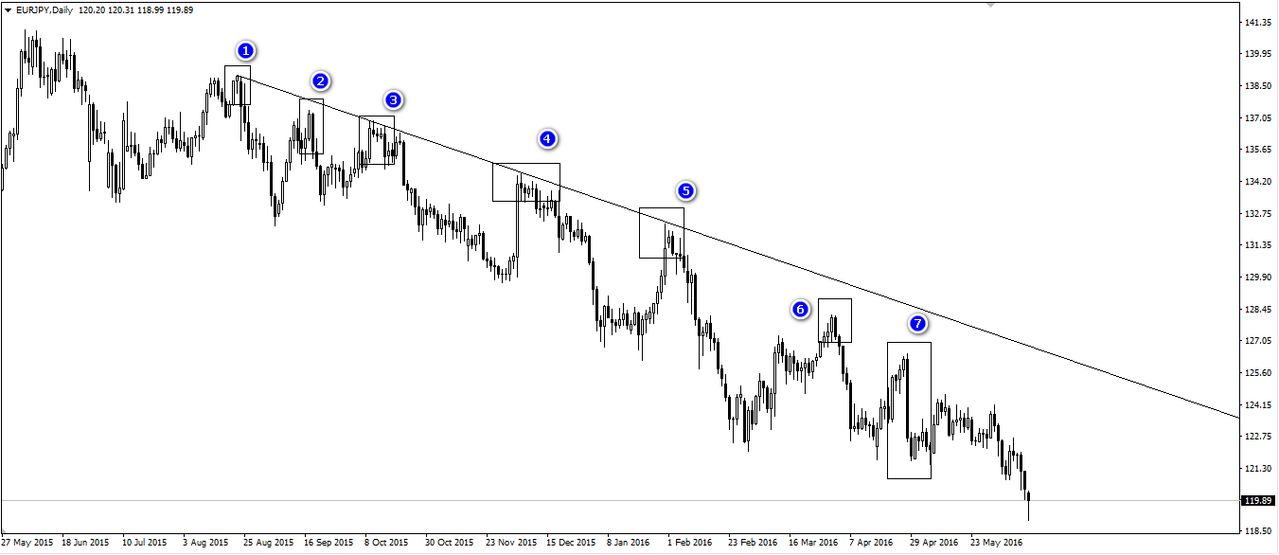
Below I have provided one example to make my points clear.

By connecting the points 1 and 3, I have drawn a down trendline on a eurjpy daily chart. As you can see, nearly every retracement on this chart is followed by at least one major candle combination. Below I will provide quick explanation for each of these cases.
1 - Classic hanging man pattern. Small white candle with long lower shadow, no upper shadow is followed by a large black candle
2 - Bearish engulfing pattern - At this point, we still do not know whether the trend is up or down (at least on this chart), but previous hanging man and this bearish engulfing combinations indicate some bearish pressure.
3 - Bearish engulfing pattern - At this point, it's quite clear that the trend is down and once eurjpy moves lower, we can draw our trendlines and more importantly, take trades on subsequent corrections with more confidence if we see candlestick patterns at a 50% or 61.8% correction levels.
4,5,6,7 - All are strong bearish engulfing candles, even though later corrections did not touch our trendline, emergence of bearish engulfing lines could have been potent evidence that the downtrend was indeed accelerating.
Sometimes, it's not pssible to draw trendlines on certain trends, especially if their rate of ascent (or descent) is very fast. In such cases, we can apply moving averages and expect corrections to end aroung them. Most popular moving averages are 20, 30 and 50 periods. In any case, our primary tool for trading remains candlesticks themselves.
I hope this tutorial will be helpful to those who are not familiar with candlestick trading
Happy Trading
If you like what we are doing don’t forget to UPVOTE, COMMENT and RESTEEM.
It would be greatly appreciated. :-)
@asifhussain
Nice information thanks