HNS Pattern Already Done
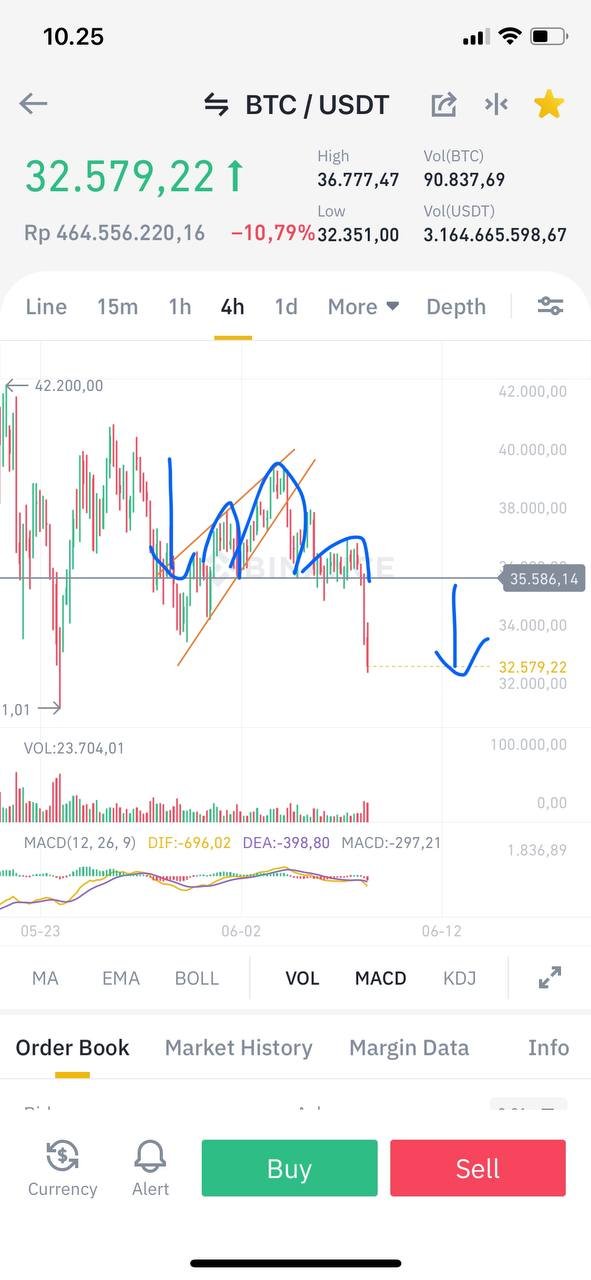
The bitcoin chart on the 4h time frame a few days earlier shows a bearish Head and shoulders pattern.
Today the breakdown was confirmed after breaking the support at $35,500 and some time ago it has reached the next support at the price level of $32,500 - $32,000. In this area there is a rebound and there is resistance from buyers.
If the level of $32,000 is broken, then the next support level is in the area of $28,500