Global market overview (BTC)
I would like to start new series about global trading in crypto-currency world. This series should be unique because every site on the internet is presenting just piece of stats from BTC trading. The reason is simple . Affiliate marketing. I have decided to explore world of cryptocurrency trading without any preferred sites or exchanges. This project is targeting global exchange platforms with impact on the market. Prospect for future is also important. I will add some new platforms to see if they might be successful in global scale. I am going to show you interesting stats for better understanding of whole picture. This post is only basic pilot. I will add more interesting features in next parts of this series.

Main focus
- global trading volume
- disproportions on the market
- monitoring of most traded currencies and related products
- monitoring of changes on the exchanges as fees, accounts, products, technical solutions
I hope you will enjoy those stats

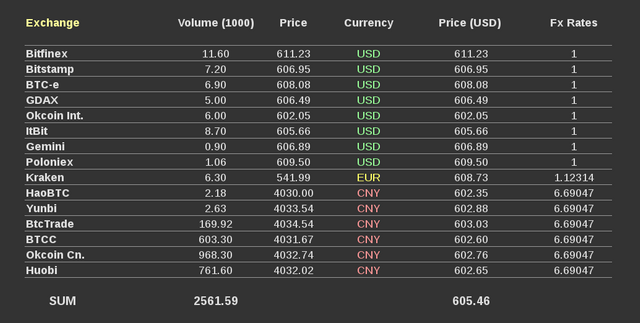
In this image above you can find most interesting exchange platforms by the traded volume. There is also benchmark price for better comparison of those platforms to see arbitrage opportunities. The report will be published every day before US trading session. ( poloniex included because of steemit users. This exchange platform has no any impact many of you may appreciate to see this comparison.) The Fx Rate is added because is very important to recalculate any exchange price to the benchmark currency (USD).

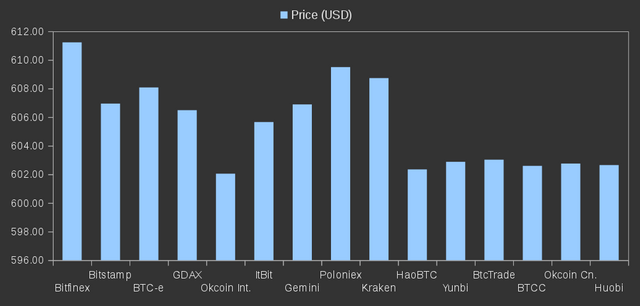
At the picture above you can see disproportions in price by the benchmark currency (USD). I will explain fundamental reasons why those prices are different. Of course , all of you know that BTC is decentralized currency. The fact is that any other Currency is decentralized as well but price is same almost everywhere.
I will try to explain reasons of those curiosities.
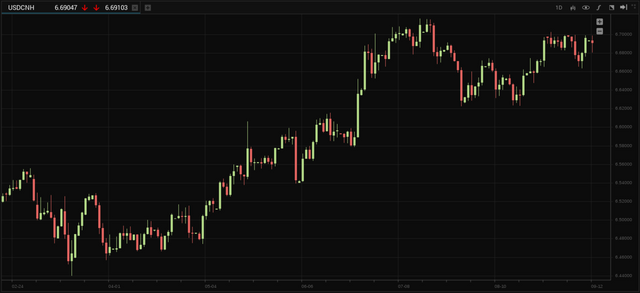
I would like to post actual exchange rates of EUR/USD , USD/CNY as well because is the part of the game. BTC is also currency as any other. Here you can find daily charts of the current exchange rates for EUR/USD and USD/CNY


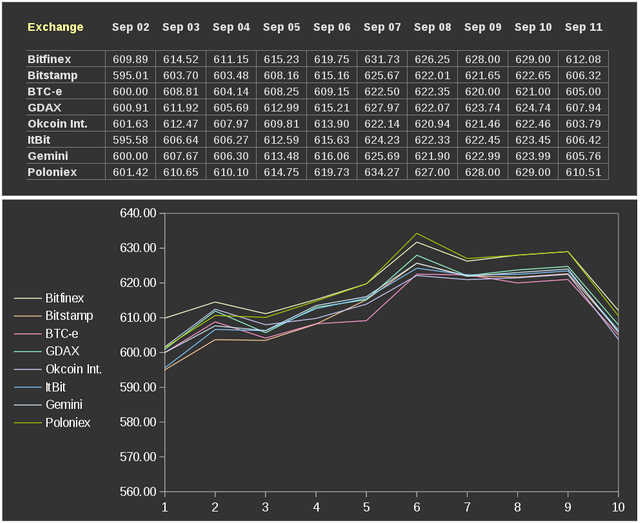
The last picture is just very short overview of disproportions from past 10 days. It is very short history but for demonstration is enough. As an example I put only USD denominated pairs. This is just small piece of what I want to show you on daily basis. Take this post as a start and presentation of the project.

This post has only educative character. Do not take it like an investment advice.
If you have any comments or ideas of what you want to see in next episode, please leave the comment.