Crypto Roundup

A wild week with some short term bearish, long term bullish news!
One bearish news event after the other, but just a perfect lesson in why traders use stop-losses to prevent losing their shirts during a draw-down in price as we have experienced across the board.
News out of China, though a lot of misinformation is floating around, it seems certain exchanges will be halted for suspicion of criminal activity. I.C.O. are also halted, and coins will be delisted from certain exchanges, while Chinese IP addresses may also be banned.
What regulators appear to be trying to do in China is clean up the industry, rather than fighting time, it seems they opted to temporarily halt certain exchanges and all I.C.O. activity. Short term this is bearish, long term it is the start of a massive consolidation in the industry where there won't be 4403 coins to choose from. Wealth will consolidate into the top projects with the highest probability of success as viewed by the investors as well as regulators.
So let's be clear: There are a lot of dynamics going on that make taking new positions very risky for the less affluent as well as the pro. There is nothing wrong with sitting out until clarity is found.
Bitcoin
Daily Chart
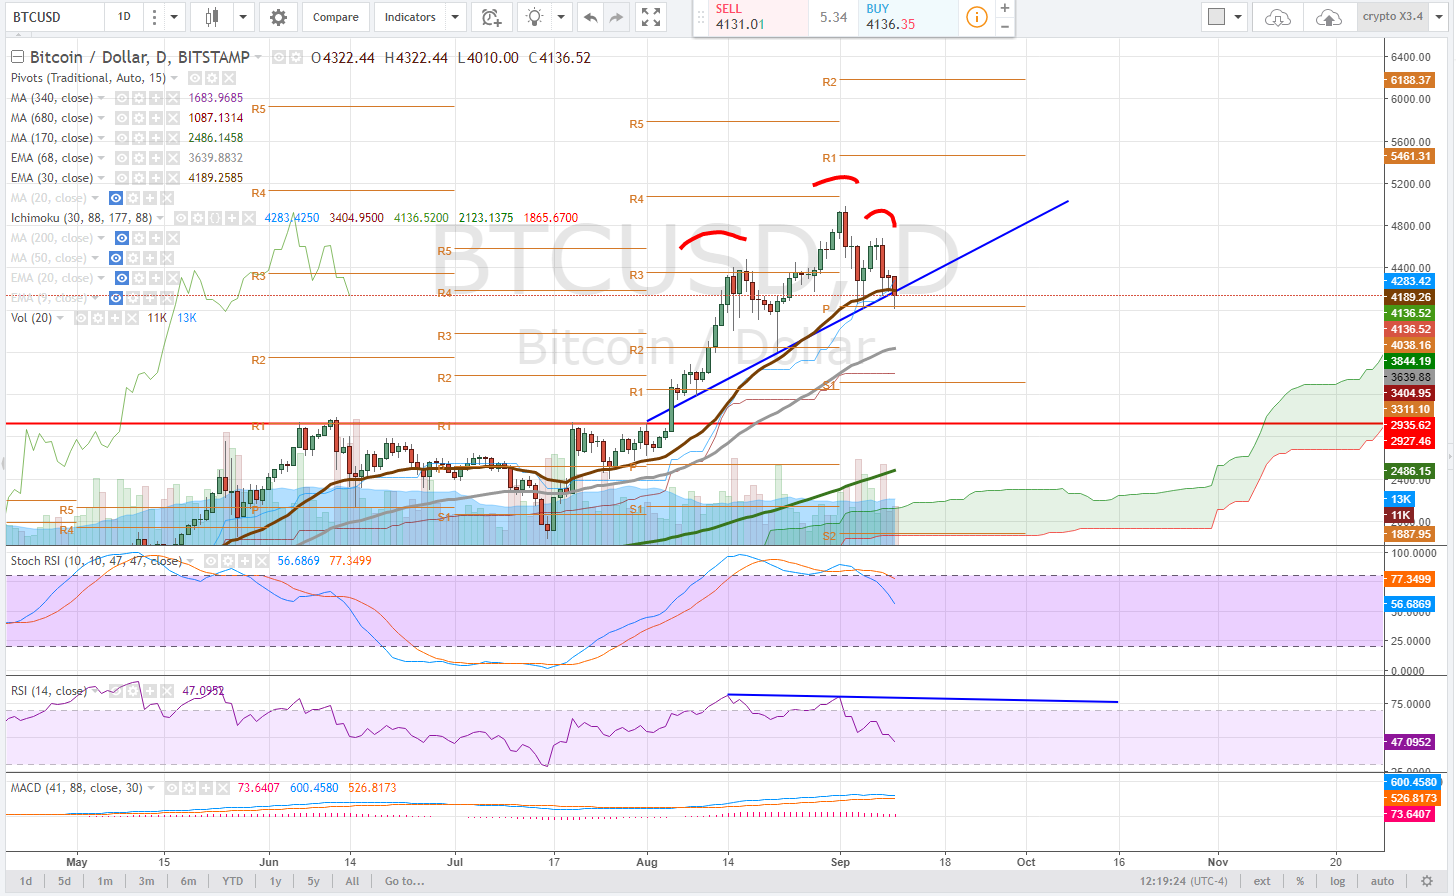
Bitcoin on the daily time frame has formed a head and shoulders pattern, testing the neckline at approximately $4162. The RSI is trending down and the stochastic RSI is slipping from uptrend putting pressure on the MACD for a bearish cross.
This down draft saw Bitcoin test pivot support of approximately $4078 overnight and this morning attempting a back test of this breakdown. Dip buyers and bulls are trying to reclaim $4162.
4 Hour Chart
On the 4-hour time frame, Bitcoin found support at the top of the Ichimoku cloud with a near oversold RSI and stochastic heading back into a downtrend.
In order for bitcoin to remain bullish and not form a bear flag, a break above the neckline approximately $4162 on volume is required to reverse the trend. This neckline will be an extremely difficult support to break above.
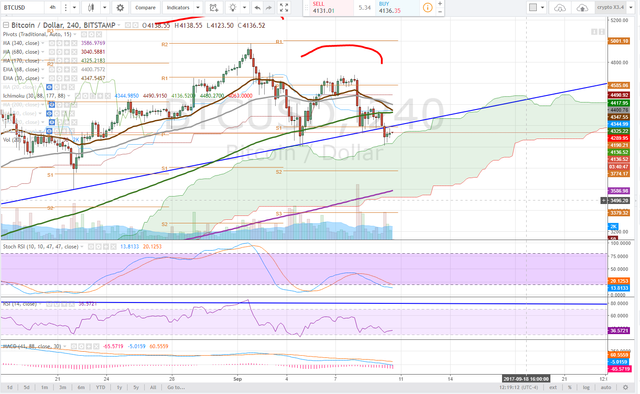
Trade: Enter here in a small position, walking stop-loss up with price progression, add on a break above neckline. Continue to walk stop-losses up.
Alternative Enter on break above neckline, stop-loss just under it.
Risk: This is a risk trade, No reason to take them here.
Ethereum
Daily Chart
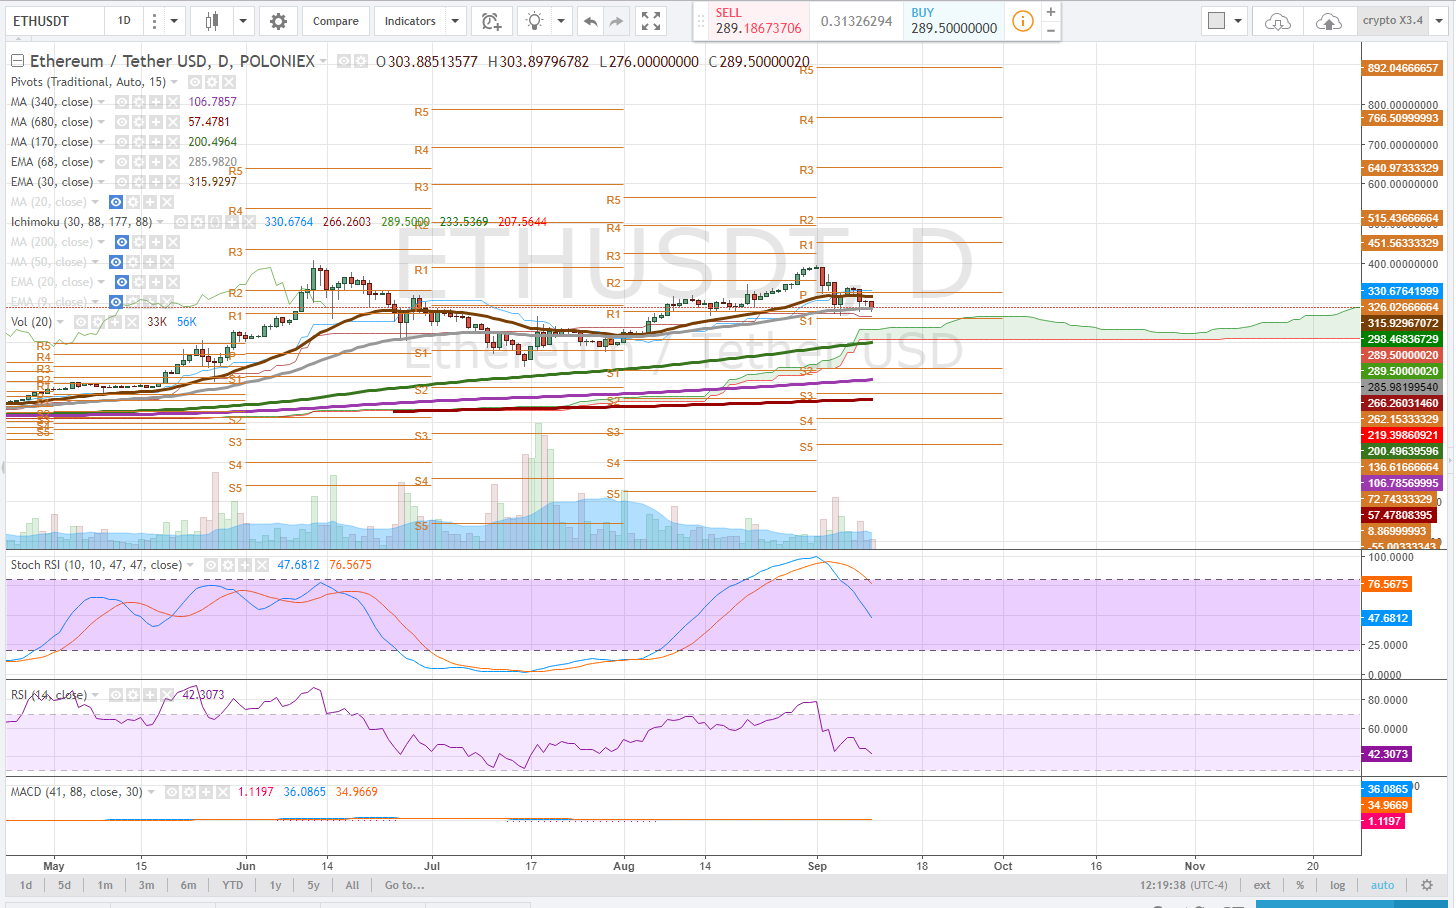
ETH on the daily time frame has set what could be viewed as a double top until we see evidence of further price progression. Not the MACD and STOCHASTIC RSI heading into down trend. Clear support is the 68ema, approximately $285.
In this draw down, ETH lost the daily pivot support and traders will be watching here for a bounce and back-test. Bulls need a break above. If ETH continues to hold this $280 - $340 range it is possible to see the formation of a bull flag, but this would be a highly speculative observation.
4 Hour Chart
On the 4-hour time frame, ETH has hung on to pivot support 2, approximately $285, where we observe some longer term moving average support as well. A tightening range is occurring however as we observe the bearish convergence of longer-term moving averages.
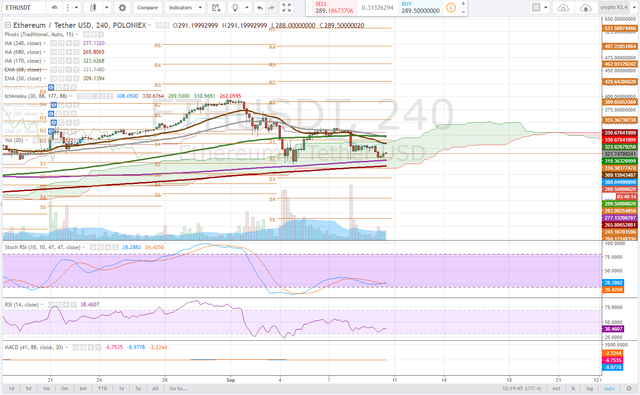
Trade: Long here, stop below $285, up to $276
Alternative Wait for break above shorter term moving averages, set stop-loss at them.
Risk: This is risk.
LiteCoin
Daily Chart
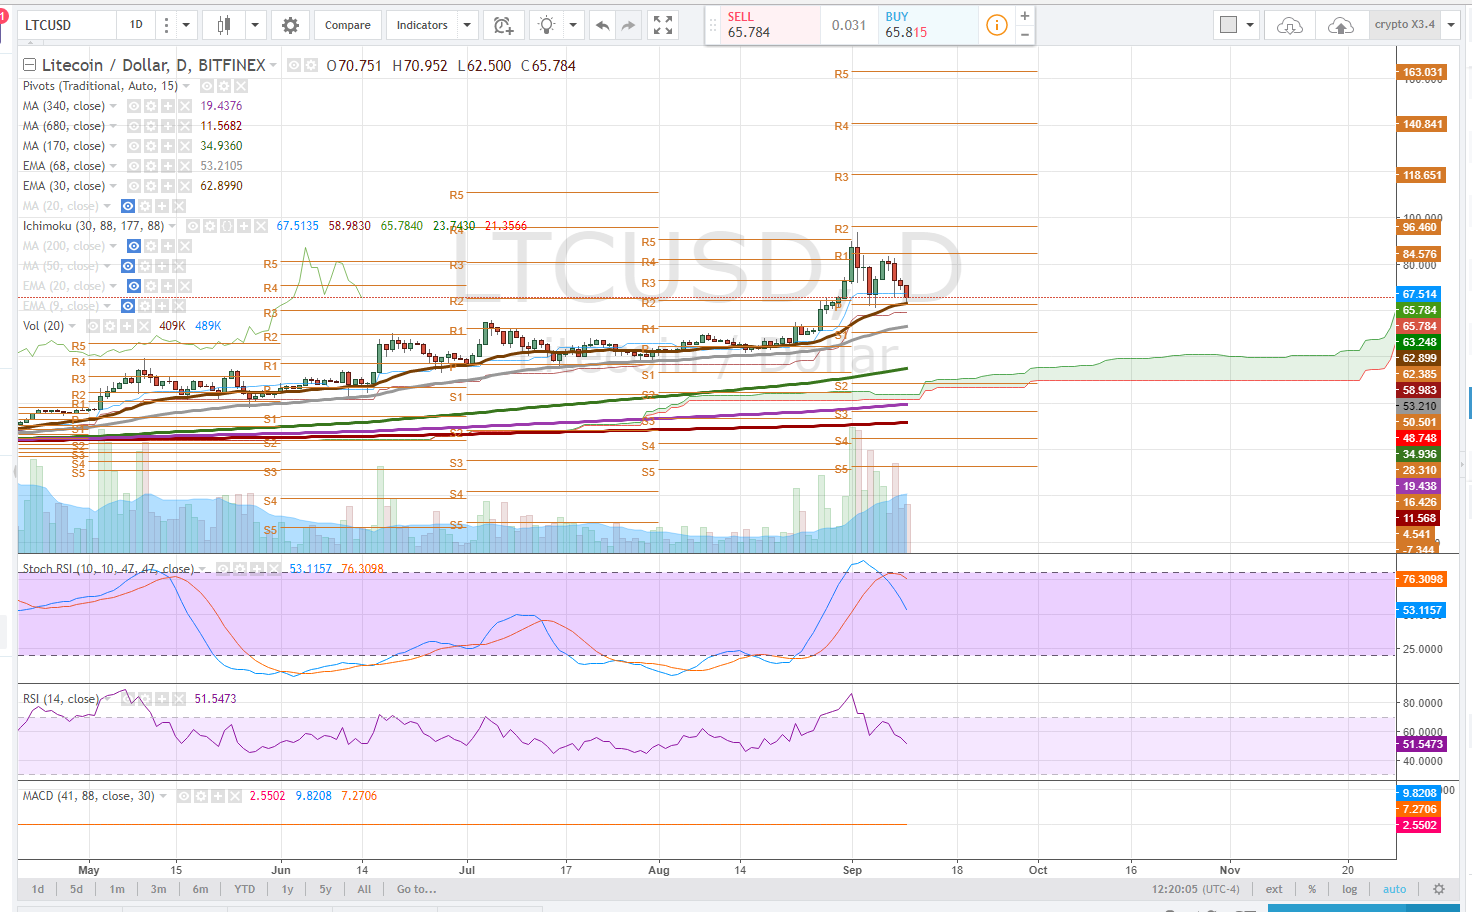
LTC has test daily pivot support 3 times, bouncing from it each time as dip buyers stepped in as the 30ema converged and provided additional price support. The stochastic RSI, though it has turned down from uptrend, it has not driven a significant decrease in price and it is possible LTC forms a bull flag here.
4 Hour Chart
LTC on the 4-hour time frame has been setting lower highs and lower lows, however, we are observing the possible formation of a wedge and will be looking for a retest of the upper trend line if the price can get above the 30ema, approximately $70.38.
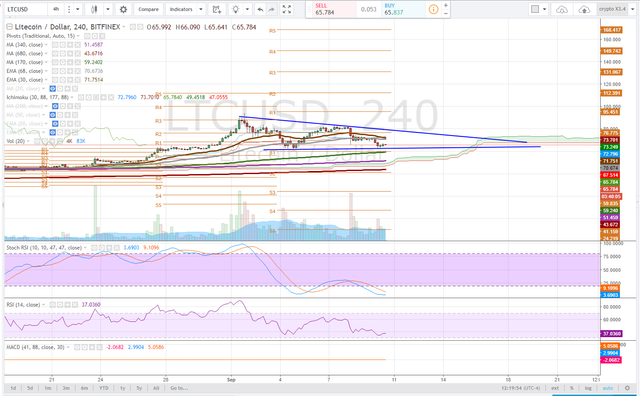
Trade: Enter here, walk tight stop-losses up, looking for a small move, retest of the upper trend line. If it breaks on volume, continue to hold. If it can't break above Close the position and wait to re-enter a retest of lower trend line if it holds. Stop losses!
Alternative Wait for a break above the upper trend-line.
XMR
Daily Chart
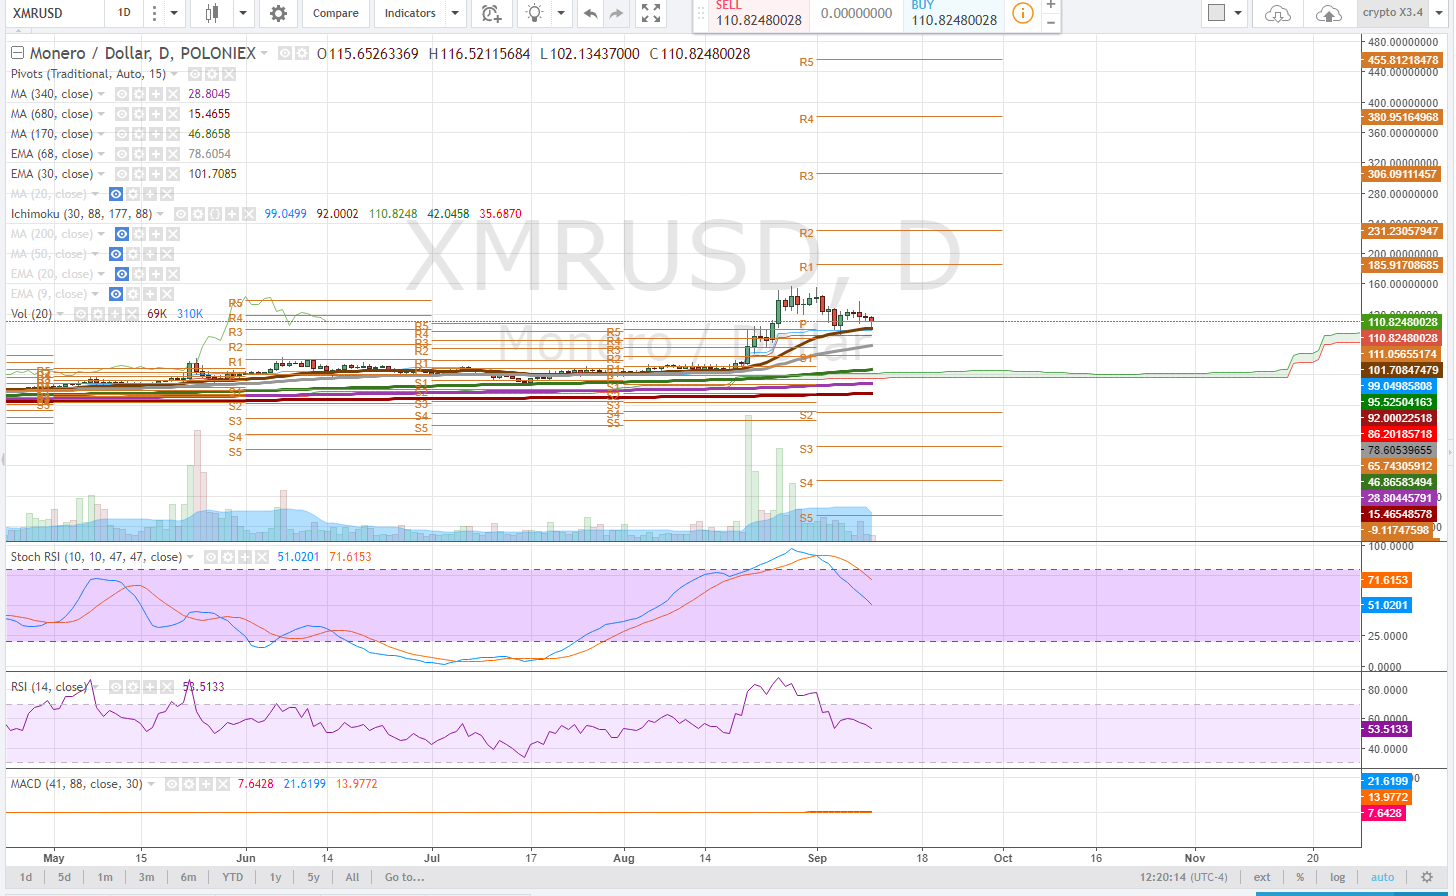
XMR on the daily time frame found support at the 30ema and is working to reclaim the daily pivot support, $111.
4 Hour Chart
Some bullish moving average crosses are helping to support the price while the stochastic RSI inches up. XMR on the 4-hour needs to break above the 30ema/68ema convergence on volume to reclaim the daily pivot support
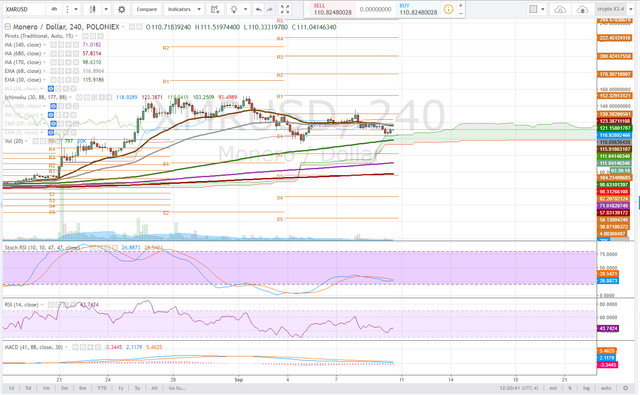
Trade: Bearish below the daily pivot, bullish above, no need to take risks on this alt coin as it has already seen gains of over %400 in about 2 months.


There may be a delay between the time this article was written and the time it is posted.

If the actions this week was just China cleaning up the bad exchanges on local basis, that is long term very bullish
We are on the same page! In the immediate term these curve balls just need to be digested!
Thanks for sharing!
Dash might play a bigger role too
Can you elaborate why ?
better scalability , interesting masternode system
Hey @satchmo nice work on your analysis, I didn't catch the complex head & shoulders on BTC. Very helpful thank you.
Really good post, informative as always.
You said "a bearish market is a perfect example on why traders use stop-losses". That is only partially true. Of course, stop-losses seem like a good thing to, well, prevent losses but they are actually the reason behind posts of those heavy short-term crashes.
When the price goes down, stop-losses start to activate and perform market sells, bringing the price down even further. They are like reverse market-depth, they take liquidity away from an order book, before a trade is even executed.
I also don't really understand why traders would use them. No one would advise you to sell on the dips, right? But when it is automated, it is suddenly ok.
If you have a different opinions than me, please correct me, I would love to hear it.
Capital Preservation is the number 1 priority of a trader in practicing good risk management. Traders don't hold positions and add the way investors do. Trading is a high intensity activity with high risk. So when I said a bearish market in the context of the recent draw downs is the reason a trader would use a stop loss is to either have lock in gains if they rode to the top, or if they were buying a dip hoping to make a trade, to prevent going down with the ship.
BTC has gone from nearly $5000 to $4000 -- 20% draw down.
In the nearer term you saw it go from $4600 to $4000 - If a trader is locked into a position how do they continue to trade. If a trader is at profit, they must realize those gains to have progression in their portfolio.
Good point. But would you agree that a price alarm is a better idea because a trader can make decisions before your crypto gets sold automatically? Maybe even in combination with a stop-loss?
have both, but always respect stop-loss... not that i dont break my own rules heh
Wow, thank you for taking the time to put this together. That’s a lot of info available in one place, easy to scroll through and glean what one would need. I don’t have a crypto clue, it’s all extremely new to me. It’s obvious you have a good grasp of this and put the time into to better the Steemit community. Your passion for the topic comes through in your post. Do you have any advice for a Steemit noob? I upvoted.
Vey important good information thank you for sharing.
Hi mate. You obviously know your stuff on crypto. You might be interested in my contest "Battle Of The Crypto Coins". All you have to do it choose a crypto coin and if gets the greatest percentage increase over the week you win $50 SBD, 2nd place wins $25 SBD. I had 17 entries last week, 14 so far for Week 2. Would love to have you on board :)
I've just looked at your account and seen it's value! Well I guess you won't be interested in the $50 prize haha. But still would love it if you could enter, winning stuff is always fun, even if it's just for glory! :D
Hah thanks for the comment, I personally will enter, I am a writer for this blog ;-)
Cool yeah join in. The deadline for Week 2 is in 2 hours just so you know :)
The volatility is actually kind of exciting. Learn a great deal from you. Thank you!
Quite welcome!
I think this is all just temporary and everything is gonna be same as before. Good article, cheers.
I agree, it's a hiccup so to speak. We shall see how the landscape continues to develop. For traders this news flow creates volatility and therefore opportunity.