ADSactly Crypto Roundup
Bitcoin

Daily Chart
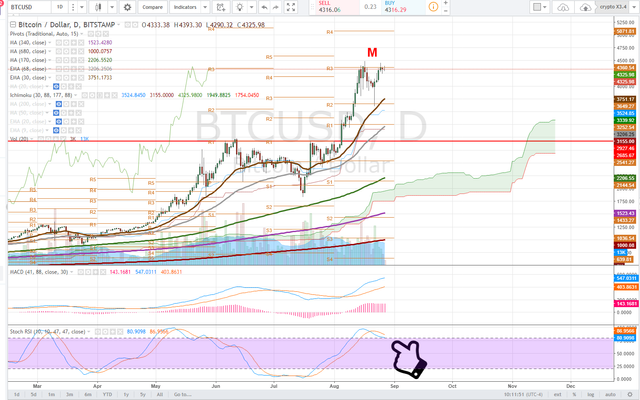
Bitcoin USD on the daily time frame has made some pretty massive and profitable moves for some, but has still failed to print a higher high. BTCUSD is possibly setting an M Top, or double top which could lead to some heavy downside action.
In order to remain immediate term bullish BTC USD needs a surge of buying volume to eat the supply up here in the 4300-4400 range.
Notice the extended daily stochastic RSI. Traders and investors should view BTCUSD as trend-less until it chooses a direction. If BTCUSD fails to get some bullish momentum a trip to the 30 day exponential moving average is expected where we would look for buyers to step in or not. On the other hand if demand comes in here we would look for a higher high to be printed.
4 Hour Chart
Counter to the M top this could also be viewed as a bull flag on the 4 hour time frame, however we again look at our momentum indicators, the stochastic RSI and volume. The Stochastic RSI on the 4 hour time frame is starting to curl down while volume wanes.
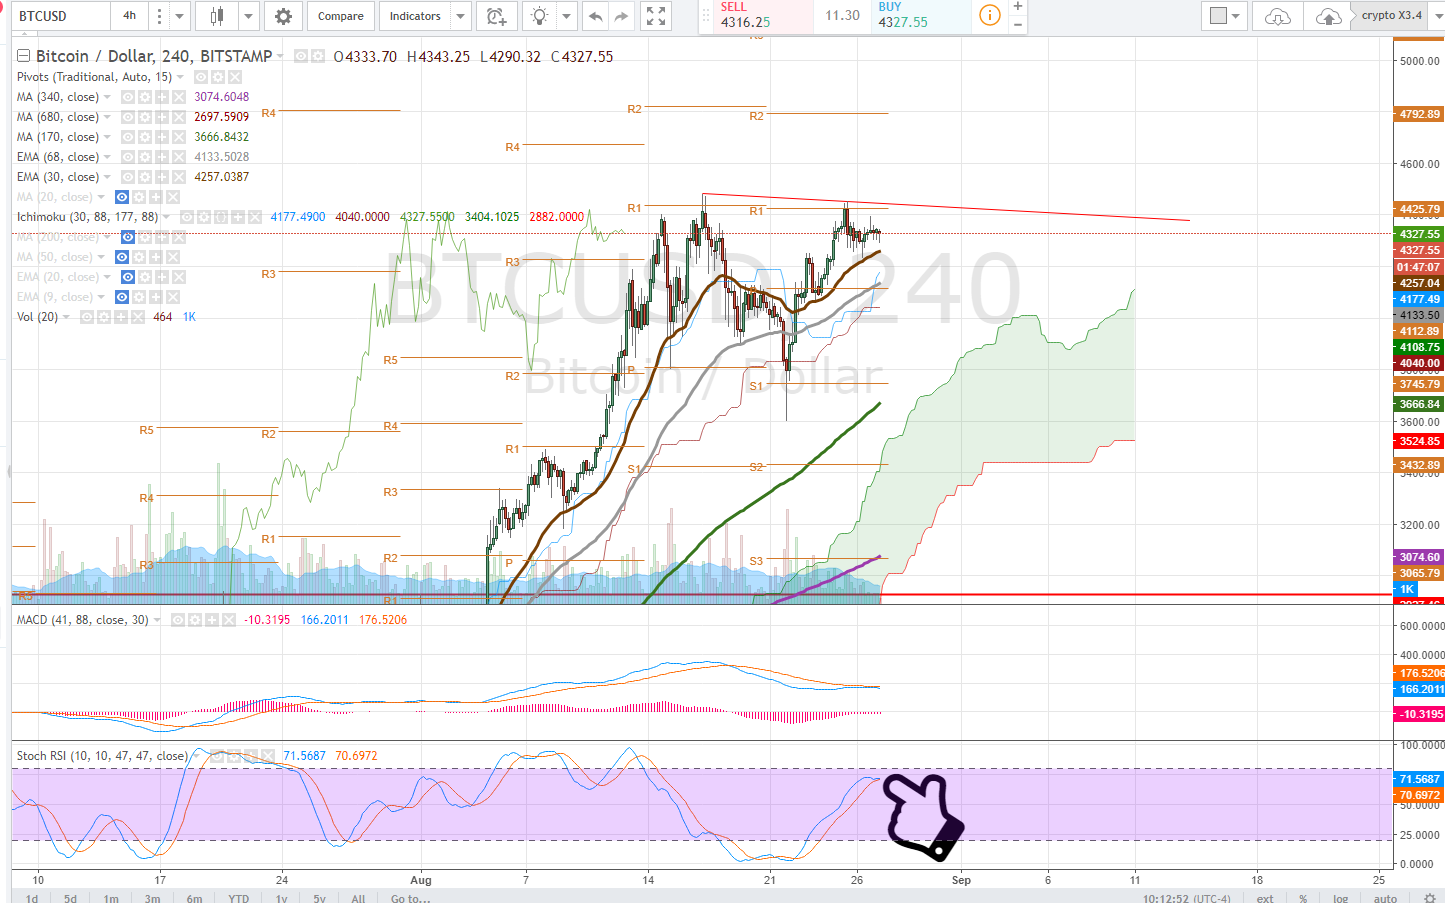
BTCUSD is a mid ground trade at the moment and the risk averse should be waiting for direction to take a position or setting a stop loss to lock in gains or prevent losses.
Ethereum
Daily Chart
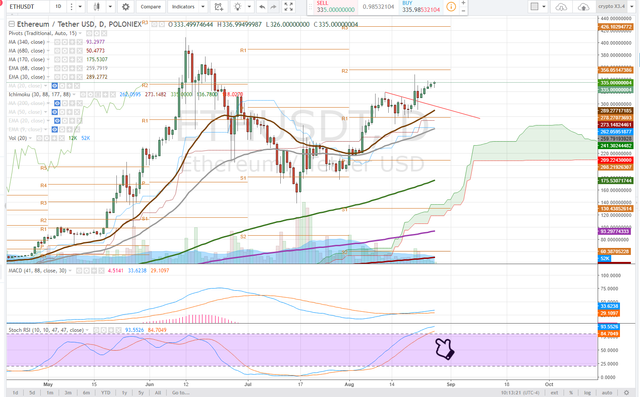
Ethereum recently broke out of a bull flag on the daily time frame on volume testing the $347 level before backtesting the breakout. Notice the Stochastic RSI has reached oversold (uptrend signaling). Again, ETH needs buyers to continue to come in and push higher or we will see another re-test of the bullflag breakout - approximatley the $308 level.
4 Hour Chart
The 4-hour time frame is showing us a stochastic RSI that is in the midground, not oversold, demand for ETHUSD would continue to drive the uptrend here and we look for more volume.
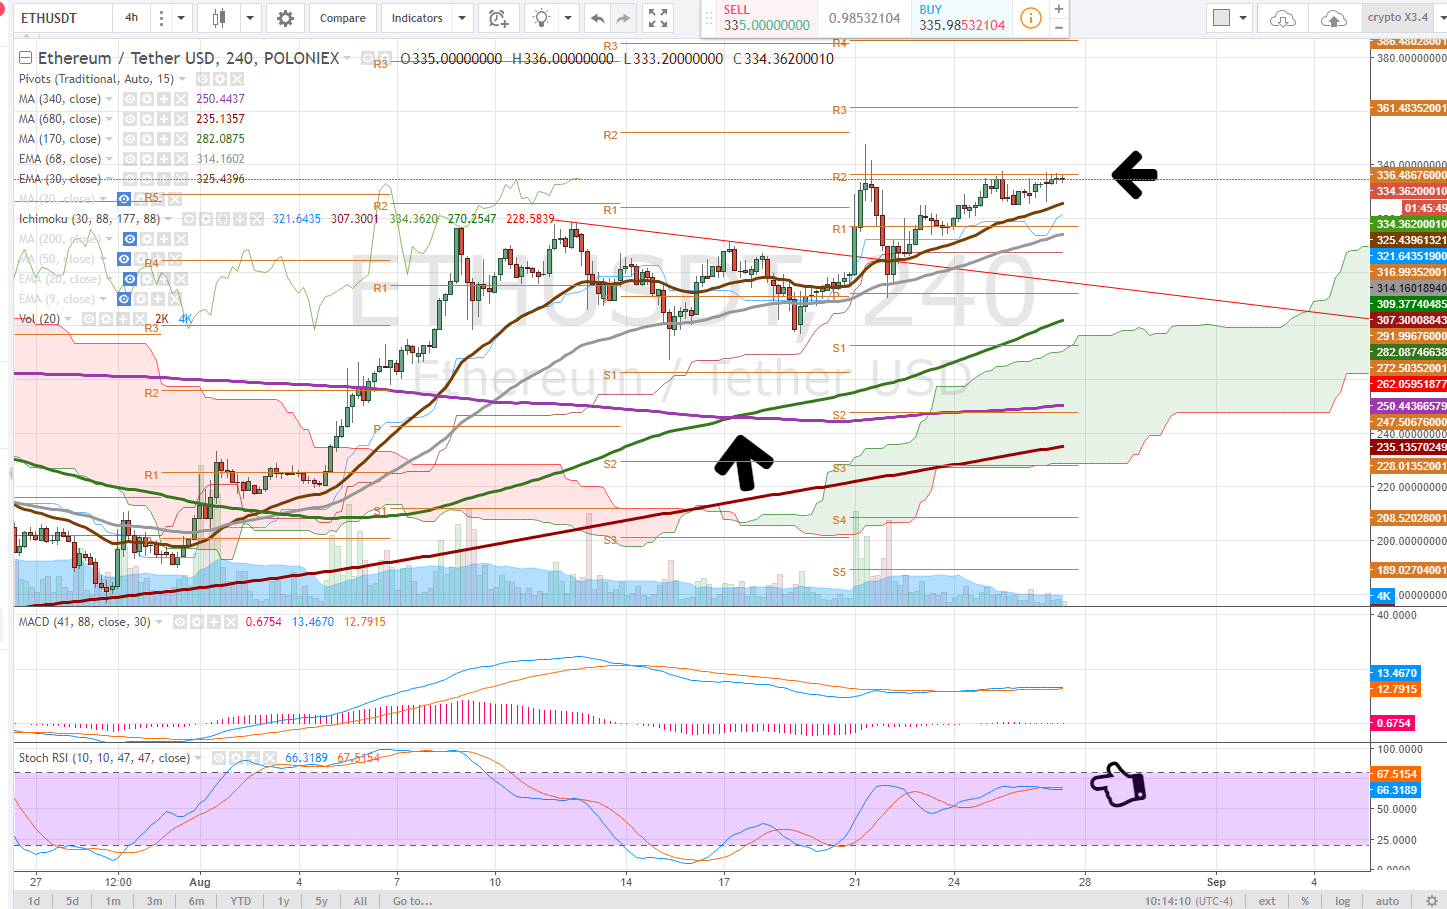
Entering a trade here is a little risky, traders and investors should wait for a surge in volume or scale into position, buying some now and adding on upside confirmation (volume) or on a pull back, ready to take a loss if the price looses the $300's level
LiteCoin
Daily Chart
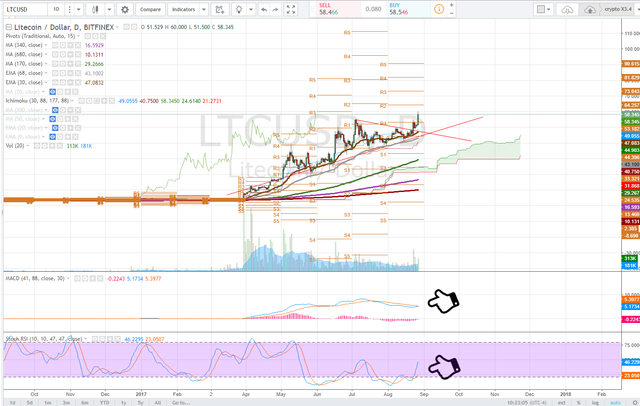
LiteCoin made a massive overnight move as it broke out of the wedge that had formed on the daily time frame reaching over $60 and setting a new all time high. This is very bullish price action and we look to the stochastic RSI and MACD for an idea of further strength.
The Stochastic RSI has just turned up from downtrend and this has set the MACD up for a bullish cross. After a pullback and price consolidation, I expect the bullish momentum to continue, however, traders and investors should always be cautious buying high.
4 Hour Chart
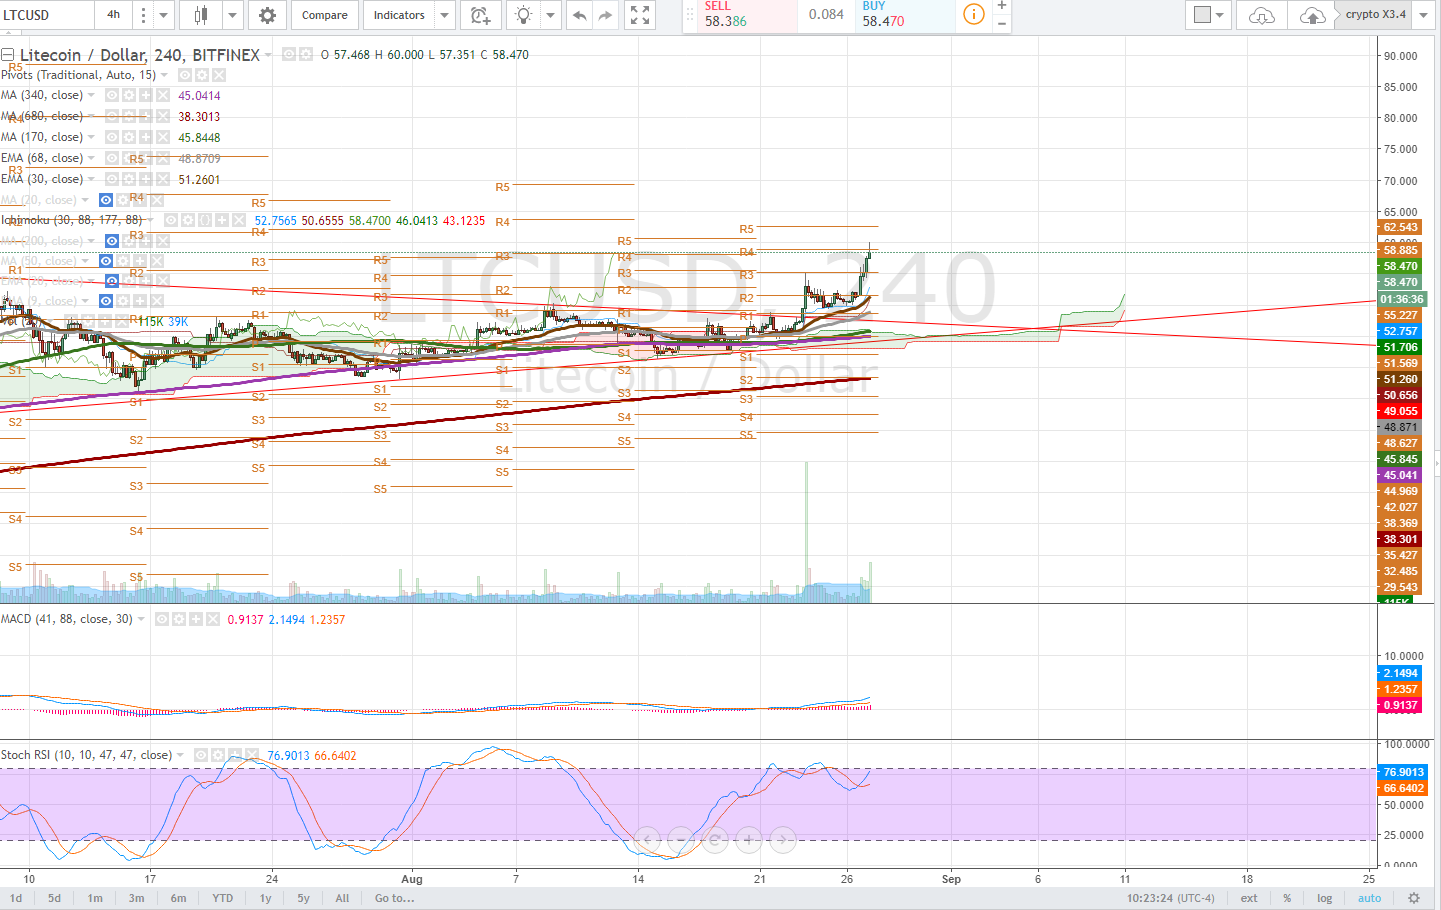
The 4 hour timeframe displays some very obvious spikes in volume that drove both the Stochastic RSI and MACD bullish. A backtest and hold of the $55 range would be a buying opportunity.
BitCoin Cash
Daily Chart
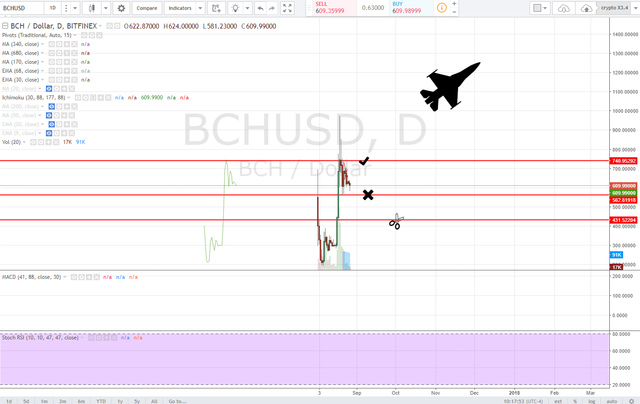
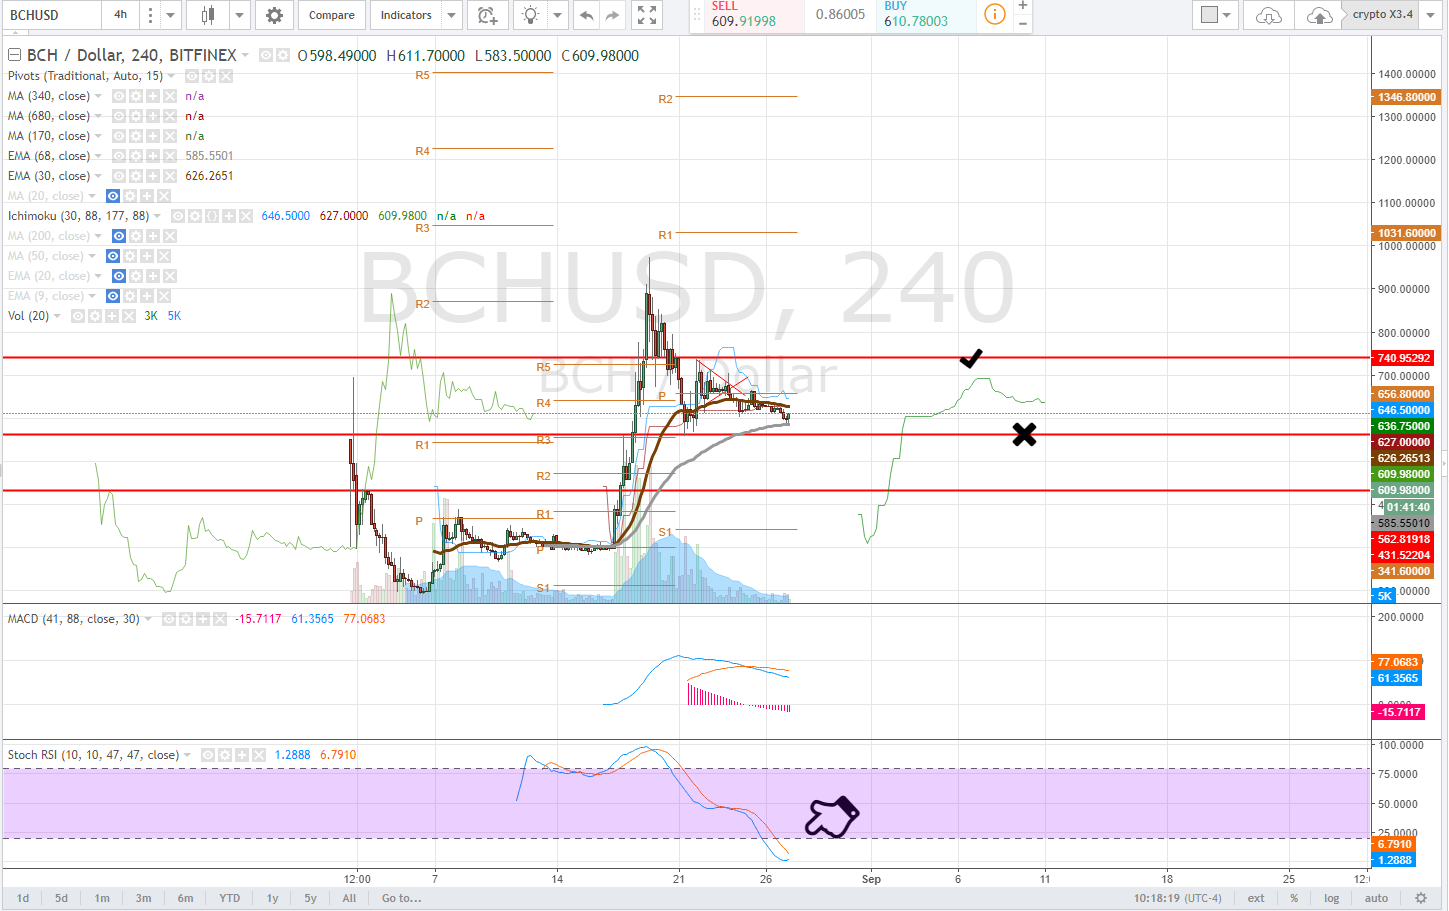
With little chart data, bitcoin Cash is a little more difficult to do technical analysis on. With the daily time frame we have identified some key areas of support and resistance, Support being $562 and resistance at approximately $740. On balance the candle stick formations appear to be a bullflag, however I would warrant caution as this can become extremely volatile depending on the direction of BTCUSD.
4 Hour Chart
Clear support has been found at the 68 day exponential moving average with some buyers stepping in. If one took a position here, a stop loss below this level would be excellent risk management.
XMR
Daily Chart
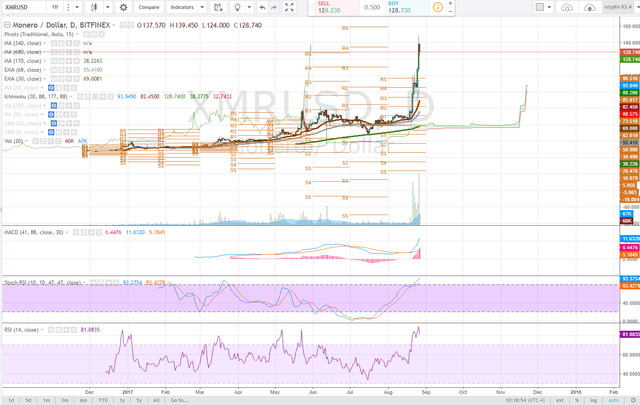
XMR broke out with some insane gains, however the price action is becoming less sustainable and we are seeing some consolidation to the downside up here. Buying here is not recommended. The RSI is deep in overbought territory and a pullback is imminent. Wait for the Stochastic RSI on the daily time frame to full cycle before taking a position.
4 Hour Chart
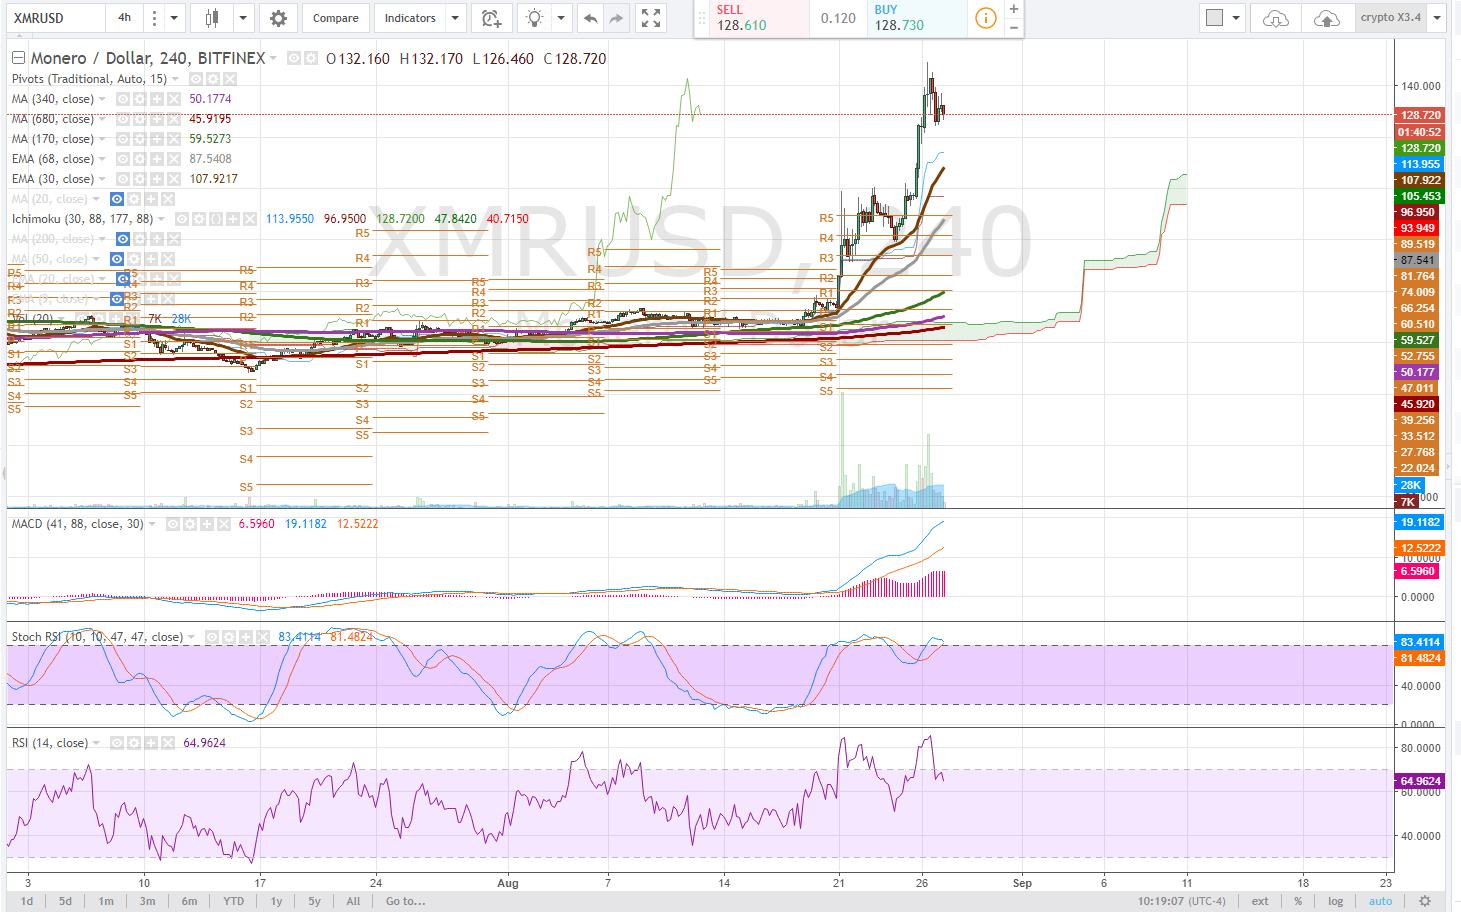
On the 4 hour time frame, notice the Stochastic RSI curling to the downside, if it achieves a bull cross it will drag the MACD down with it. I would look for support around the 30 day exponential moving average, currently $108 and if that fails to hold a back test of the previous high $101. Failing to hold $100 would be very bearish as this a psychological level. In otherwords you would be crazy to buy here, patience will pay off if you are looking for an entry.
Follow at your own risk, Not a financial adviser, understand the risks associated with trading and investing. The views expressed in this article are that of the authors and are intended mostly for educational purposes. There may be a delay between the time this article was written and the time it is posted.

All going high
It seems like Bitcoin is stuck at that $4400 mark. Any ideas what when it will get bumped up a level?


http://www.FlippyCoin.com is the #1 Cryptocurrency Exchange!
11 COINS FAUCET FREE EVERY DAY
FULL WALLET FUNCTIONALITY
https://goo.gl/aCKaJ4 Qoin
START WITH FREE COINS
Signup and we will credit your Qoin wallet everyday with:
0.00000250 BitCoin
0.00007671 LiteCoin
0.00604838 FeatherCoin
0.24640460 Virtacoin
0.00056826 PeerCoin
0.00004063 Dash
0.00025130 Neo
Trusted 2014 - 2017
Hi adsactly,
Thanks for the great content
look my post about waves. I think is interesing currency. It have LPOS , you can earn tokens leasing your waves
https://steemit.com/cryptocurrency/@superpako/waves-plataform-and-lease-cryptocurrency
All this analysis has me feeling dizzy. All i want to know is when will steem be at $10 per coin and if there is anyway we can speed up this process, haha
to be honest I think even though Steem is still undervalued and it will rise more, it will never be as lucrative and have the potential to gain as much as other cryptos due to it's essentially unlimited supply.
That said, investing time into this platform and building a solid following is another thing entirely ;) Seems like you're on the right path for that. 47 high five!
buy all of it ;-) LOLOL!
Hoping for LTC to reach around $80 at some point...but best laid plans and all that 😆
Yes best laid plans and all that ;-) -- the ideal would be more ATH's after more ATH's ... if you notice LTC is one of few tickers that has held a consistent uptrend. Thanks for commenting!
Yeah. My ballpark expectation for a pullback is 50%; Whereas for an increase, I like to look for a 2x gain...in this case it was stable around $40-ish, hence my target. Nothing to say it will do it, but I'm surprised by the number of times it does happen 😀
May i recommend looking up fibonacci levels and technical analysis, you may not be so surprised! ;-)
Yes.... I should do - problem I have is that on cryptowat.ch, they usually go off the top of the screen haha, and I'm using an iPad these day🤣
But yes - thanks - I know my Fibonacci retrace numbers - just need to learn the Fibonacci extensions too :)
check out investing.com --- its a tradingview API -- mobile they will have a technical option where you can view areas of support and resistance including fib. On desktop you can do charting!
Great, thanks!😄
Surely we always hope the best
Can you trade hope? lol my motto haha
Pretty funny meme in trading equities is hopium
Thanks for sharing! I'm not a technical analysis pro myself but I've been watching the charts A LOT the last few days and my gut feeling has essentially mirrored your report here :) I think for pretty much every crypto right now, it's not a good time to put in fresh fiat $. Best to wait and see what happens.
One quick question, re Bitcoin cash you say:
"On balance the candle stick formations appear to be a bullflag, however I would warrant caution as this can become extremely volatile depending on the direction of BTCUSD."
My question to that is how would you tie it to BTCUSD? Is it inverse? Sometimes it seems when BCC surges BTC goes down and vice versa. But it doesn't seem completely set in stone.
In my opinion since BCC last surge there is a bit of an inverse correlation to BTCUSD as BCC surge to 900 was fed by BTC drop to 3600 -- i would expect this to wane over time as the cryptos become independent but as of right now they seem to be viewed as competitive coins especially because of mining and sentiment - as we are not yet trading against robots and algorithms, it is up to the sentiment of the people by and large.
If you would like to learn a bit more about TA and FA I wrote an article just a few days ago for ADSactly, a basic overview and some tools. I personally am always up for helping if you have any questions i'll do my best.
Thanks for sharing! Yep good old Suppoman echoed the same sentiment, not necessarily in regards to BTC BCC but just BTC and altcoins as a whole. Up until now the altcoins have generally (with a couple exceptions) seen major drops and gains along with BTC. Also, in the last few months haven't been able to keep up with Bitcoins gains - in other words we would have been better off just keeping all our money in BTC this summer instead of altcoins. But he said that will be changing as more $ flows in to cryptos and people look for alternative investments outside of BTC.
Cool, can you post a link to your article? I never think posting a link to your own post is spammy if its done within the proper context by the way, I do it sometimes too when relevant :)
The same could be said with investing in the S&P 500 or some of the major tech stocks before the recent pullback over picking other stocks, so I mean it is totally a function of the individual and their skill levels of course.
This article I wrote for ADSactly is just a nice overview to get your feet wet ;-)
https://steemit.com/cryptocurrency/@adsactly/technical-analysis-vs-fundamental-analysis
Thanks for sharing, I'll take a look!
thanks 4 sharing analyzes about cryptocurrncy
:)
Thanks for all these analyzes and illustrative curves
very welcome! TA is a great way to get an idea of what is going on with a ticker, price is king!
Lot of people are now a days jumping on to new upcoming ICOs .
I always wonder how do you guys get these many upvotes so quickly on your posts . I never get upvotes I guess I an new so .
Really informative post .
I am new to steemit soon I will be posting Crypto Posts too , I have been really doing good trades so far ,
so I would like to share my inputs so people can learn and earn .
Thanks to steemit and community for providing such an amazing platforms .
See you on Moon @adsactly
thats very good information @adsactly @satchmo thanks for share..

Support me to 😃
Well, thanks for sharing.
I come from Indonesia, I am very happy and interisting about your share.
If you have time you can visit my blog, I have new post about Indonesian steemit community friendship.
Maybe you like it.
Thanks