Equity Markets vs. Cryptocurrency Markets: Weekly Performance Review, Feb. 5 - 11

While cryptocurrencies saw some relief last week, global equity markets were hammered again. What we’ve seen is waterfall declines across the board in major equity markets. It seems like global sentiment is the culprit here, given the alignment in the severity of declines across each of the major markets.
The continued sell-off is largely seen as due to concerns over rising interest rates and an increased probability for higher inflation. World economies and company earnings generally remain in good shape, and the consensus seems to be that this more technical and sentiment based rather than fundamentally driven. If true, the odds still favor an eventual continuation of the uptrends.

This was the second week of selling, and some serious technical damage has been done in the charts so recovery could take some time. And, it’s not clear yet that bottoms have been reached. For the near-term, the U.S. market had a relief rally at the end of the day on Friday, Feb. 9, so that short-term bullish sentiment could carry over into the beginning of the week. As of last week, Jan. 29 - Feb. 4, each market is now in negative territory for the year whereas before the selling global equity markets were experiencing strong relative performance for the first month of the year.
The Shanghai Composite led the way down with a 9.6% drop to end at 3,129.55 and followed very closely by a 9.5% decline in the Hang Seng. Bringing up the rear was the BSE 30 Sensex with a fall of 3.0% to close at 34,005.76, followed by the FTSE 100, down 4.7% to end at 7,443.40.
FTSE 100 Index: all the way to bottom of one-year consolidation range
Last week’s 4.7% drop in the FTSE 100 took it straight through a number of technical price support areas of note and all the way back down to previous multi-year resistance/support from 2015/2016, and 2017. The low for the week was 7,073.00, not too far from the week’s close of 7,092.40 (weak close), while a 61.8% Fibonacci retracement of an intermediate-term uptrend completed at 7,089.20.
When adding the multi-month test of support around the 7,097 to 7,073 price zone from 2017, last week’s low looks like it has a decent chance of holding for a reversal higher, even if it is only short lived. Even so, if last week’s low is breached to the downside the 38.2% Fibonacci retracement of the long-term rising trend is close by at 7,027.10.
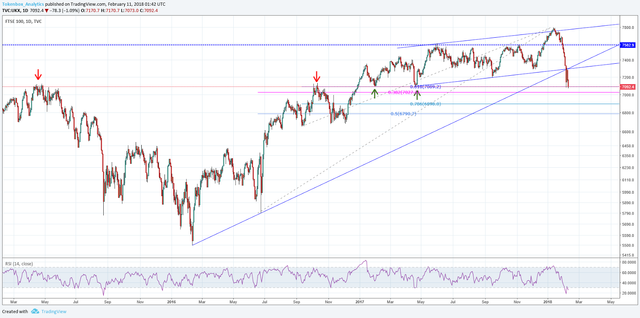
The more bearish perspective focuses on the fact that the FTSE fell straight through a one-year price consolidation zone over the past two weeks with little hesitation. That fall followed a bullish breakout seven weeks ago, a clear breakout failure. On the way down, the index fell below two rising trend lines and closed below the long-term line on a weekly basis. Plus, the close is clearly below the line. It is interesting that the two trend lines shown on the enclosed chart identify potential support in the same price zone, but the market didn’t seem to care as it went right through those lines.
A bounce from current levels could easily see resistance around the convergence of the two lines at approximately 7,272 to 7,289.
China Shanghai Composite: hard falling out of a two-year ascending channel
After hitting a two-year high of 3,587.03 two weeks ago, the Shanghai Composite Index quickly encountered resistance and turned down. As of last week’s 3,062.74 low, it had fallen 14.62% from that high. Resistance around the high is identified by multiple Fibonacci resistance levels including the 38.2% retracement of the long-term downtrend.
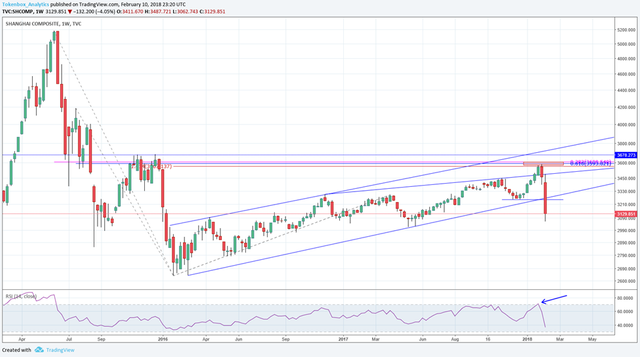
Last week a bearish trend continuation signal was given as the index broke down out of a two-year ascending trend channel, and fell below the most recent swing low, 3,254.18. So far, the breakdown is decisive given the degree of movement below the line and the weekly close at the bottom quarter of the week’s range. Also, notice the convergence of the short horizontal across the bottom of the recent swing low with the uptrend line. That would indicate a stronger potential support area; but it was easily busted, providing emphasis to the bearish nature of the move.
Cryptocurrencies: down but in recovery
In the early part of last week, cryptocurrencies continued their downward trajectories. In all cases, support was eventually found leading to strong bounces. The consensus for the sentiment shift from bearish to bullish seems to be the positive and mature outlook offered on the cryptocurrency sector by Christopher Giancarlo, chairman of the U.S. Commodity Futures Trading Commission (CFTC) during his testimony in front of the Senate Banking Committee last Tuesday. It, along with the testimony of Jay Clayton, chairman of the Securities and Exchange Commission (SEC), helped repeal growing concerns among investors that regulators would take a harder line in the U.S., and that would send negative ripples worldwide.
Once the lows were set the eight pairs followed rallied strongly, with a minimum gain of over 50% for Bitcoin, while most of the others jumped over 70%, except for Ripple which was up over 110% by Saturday.
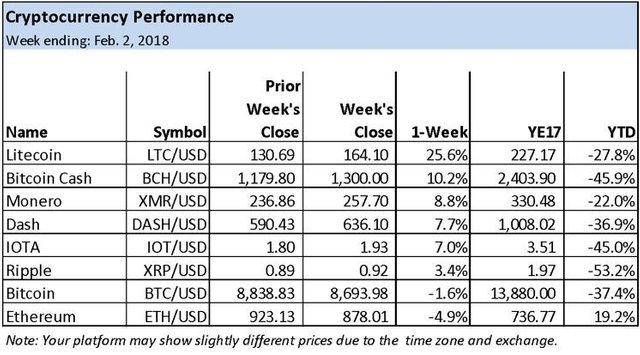
Nevertheless, each of the cryptos remains in downtrends awaiting further confirmation of strength that could lead to a sustainable progression higher. So far V bottoms are prevalent, so it wouldn’t be surprising for another test of last week’s lows to ensure that a sustainable bottom has been put in, if it has been. There is little confirmation so far that this has occurred, although it looks like it could be the case.
This week we’ll look at the charts for Litecoin and Ethereum, with Litecoin being the strongest performer last week and Ethereum being the weakest. Regardless, there is a characteristic to their charts that indicates they might be exhibiting some relative strength. The XRP chart also has this characteristic. Litecoin ended the week up 25.6% to close at $164.10, while ETH ended at $878.01, down 4.9%.
Litecoin: possible double bottom forming
Litecoin hit a low of $100.20 on Feb. 2 around support of an uptrend line, prior resistance and just below the 78.6% Fibonacci retracement of an intermediate-term upswing. It has since formed a potential double bottom trend reversal pattern with the low of the second bottom at $103.65. However, a breakout of the bottom and therefore a bullish confirmation does not occur until there is a rally above $175.00.
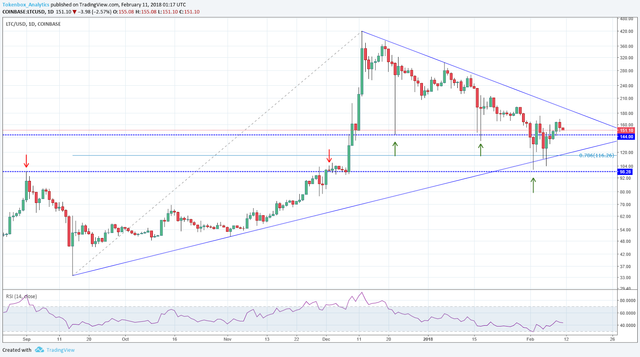
Another sign of strength for this crypto is the rally back above the prior swing lows at $144.00 and $135.00 from earlier in the current decline. That is the relatively positive technical characteristic alluded to earlier. Similar price behavior can be seen in Ethereum.
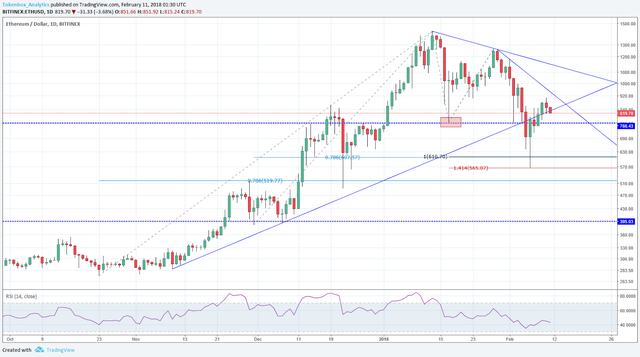
Ethereum: technical recovery above prior support
By Saturday night, Feb 10, Ethereum had bounced as much as 60% off its $565.54 low from last week. It was almost an exact match with 141.4% Fibonacci extension, $565.07, of the prior upswing. But, there was no additional confirmation of the potential significance of that price support level, and this crypto remains in a clear downtrend. However, as discussed with Litecoin, it has rallied noticeable ways above the prior swing low at $770.00 from mid-January. This may be a sign of relative strength, but we’ll have to watch closely the price behavior going into this new week.
Good read. Thanks for sharing
Welcome!!