BI Reporting: A Complete Overview
Business Intelligence is commonly divided into four different types: reporting, analysis, monitoring, and prediction. BI reporting is often called reporting. It is a part of BI features that allow you to extract and dynamically display data in the form of different types of visualizations such as charts and tables, so users can transform data into useful information and discover insights.
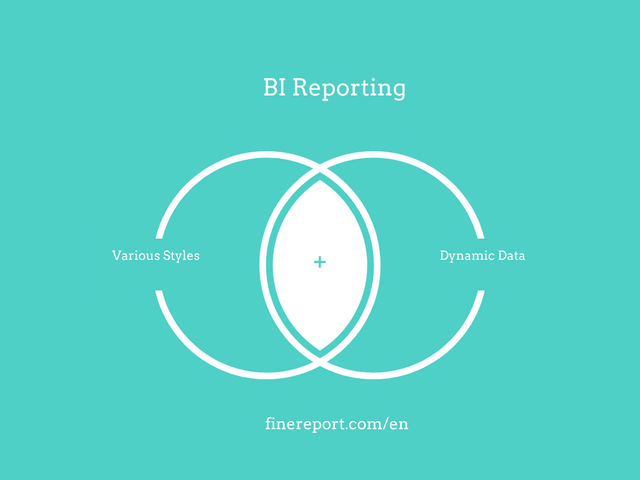
In other words, you can view BI reporting as various styles+ dynamic data.
BI Reports can vary in their interactivity. Static reports cannot be changed by the end-users, while interactive reports allow you to navigate the report through various hierarchies and visualization elements. Interactive reports support drilling down or drilling through multiple data levels at the click of a mouse. You can also use interactive reports to navigate, sort, filter, and view the data to deal with your specific needs.
Excel Vs. BI Reporting Tools, and BI Software in Reporting
Excel VS BI Reporting Tools
Before, spreadsheets play the role of bi reporting in the business. Even now, Excel is still the most popular software that companies use it to make a spreadsheet and implement reporting.
But, people who often deal with developing reports know that it is very troublesome to utilize Excel in reporting.
First, it is easy to make errors, and it is time-consuming to generate reports manually.
Second, it’s difficult to detect problems in Excel timely. The data query in Excel takes a lot of time once the data is wrong. But with bi reporting tools, you can find the demand information via simple queries with various types of widgets.
Finally, the data visualization types in Excel are very few compared to bi reporting tools. Although some of the Excel spreadsheet features are now much improved, they still lag behind reporting tools.
Click here to explore more similarities and differences between Excel and the bi reporting tool.
BI Software VS BI Reporting Tools
Most BI software has reporting capabilities. Many people confuse BI reporting software with BI software, but they are different.
In conclusion, a professional BI reporting tool focuses on data display, typically an application within a business intelligence software suite.
In contrast, a BI tool emphasizes data analysis since the BI tool is often a suite comprised of the feature of reporting, monitoring, analysis, and prediction.
BI reporting tools are primarily for IT departments or report developers. They use bi reporting software to make reports that show you the past and current status.
Complex reports such as electronic invoices, process sheets, receipts, etc. can also be conveniently generated by BI reporting software.
BI software is mainly for business departments and data analysts. The key to BI software is ‘data+business understanding.’
The ‘data’ part is the statistics and data display.
‘Business understanding’ is realizing in-depth data analysis and smart data forecasting via analysis and prediction functions such as data mining, predictive modeling, and so on. It helps you understand why the statuses are the way they are and how to improve performance.
However, in terms of making reports, BI software is weak in the richness of report styles, the diversity of charts, and print function.
Take FineReport as an example. As a professional reporting tool, FineReport provides three types of reports to help you deal with any reporting demands: General Report, Aggregation Report, and Dashboard.
Besides, bi reporting tools have powerful export and print features that support export or print the reports into different formats such as Word, Excel, and PDF. These particular functions make BI reporting tools distinctive in reporting.
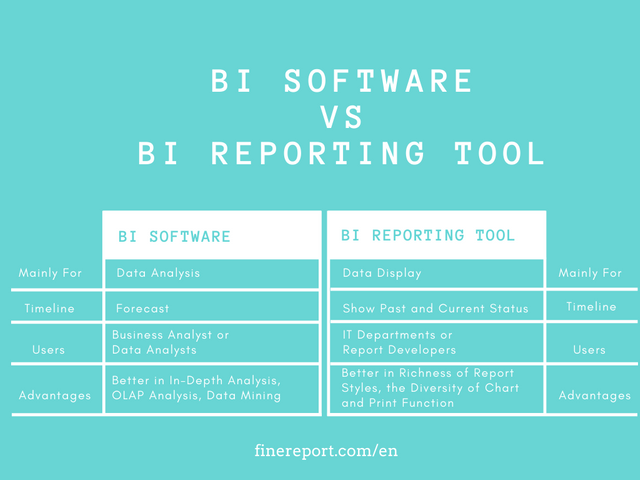
In conclusion, if you only need to do data display, reporting, and basic data analysis, a bi reporting tool is enough to satisfy your demands. If you have advanced requirements for OLAP analysis or prediction, the BI suite is a better choice.
How does BI Reporting Work?
Business Intelligence developers and report writers use BI reporting tools to define data sources, visualize data, display formats, create parameters, queries, and so on.
For example, the server of FineReport is primarily used to read and parse the template created by the designer and convert the template into an HTML page. That way, users can view, modify, and print data through browsers such as IE and Firefox. Simultaneously, a robust caching mechanism and clustering mechanism are built-in, which supports extensive data volume calculations and concurrent processing of a large number of users, and innovatively adopts flash technology, which perfectly supports zero-client accurate printing.
Using FineReport to Implement BI Reporting
FineReport is a professional BI reporting tool designed for the enterprise.
Excel-like interface, no coding needed.
As mentioned above, most companies are still using Excel to implement the reporting system. And no matter the report developers or the business staff, they are accustomed to the Excel interface. Therefore, there is no doubt that an excel-like reporting tool is the best to promote digital transformation in the company.
Innovative Data Entry
FineReport provides rich widgets that can make it easy to massive input data via forms into databases, with innovative functions such as data validation and temporary storage
Powerful Decision-making Platform
The web portal for enterprise reporting provides a very secure environment for reports management, access controls, automated reporting, and so on
Easy Deployment and Integration
FineReport is a 100% JAVA software which can be seamlessly integrated with various systems via independent or embedded deployment. Therefore, you can show your reports in your existing business system such as ERP, CRM.
Mobile BI Application
FineMobile supports business performance monitoring and data updating at any time and any places and on any mobile device.
Real-Time Reporting
FineReport supports up-to-the-minute data reports when the related data updated in the business systems. The real-time report can be checked on the browser side and sent to the set email address once any change occurs. In this way, you can monitor the performance and make instant decisions.
FineReport is free for personal use, without user and features limits. You can download it for a free trial.
Original Source: https://www.finereport.com/en/bi-tools/bi-reporting.html