Bitcoin cash price started a downtrend against the US Dollar. BCH/USD is trading below $400 and struggling to gains bids.

Key Points
• Bitcoin cash price extended its decline and now positioned below $400 against the US Dollar.
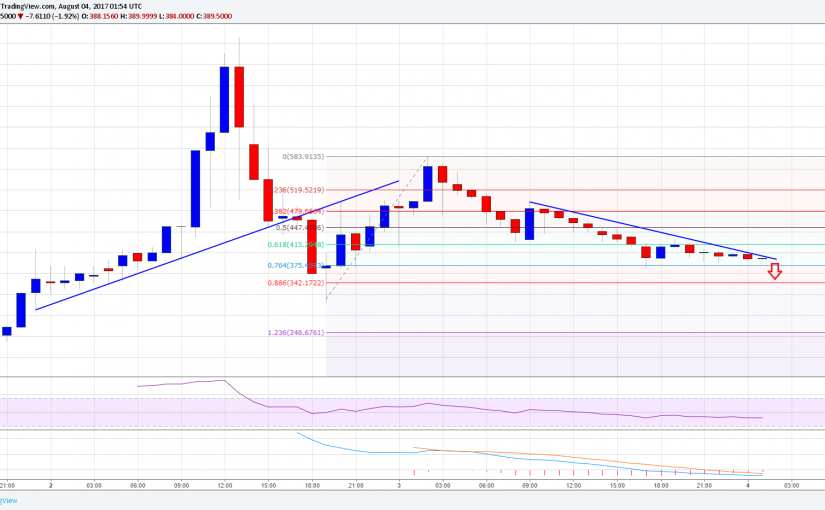
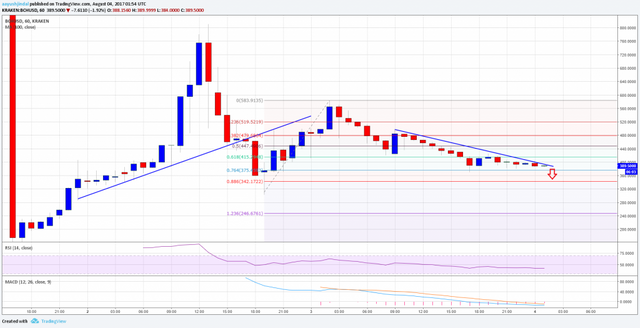
• There is a new connecting bearish trend line forming with resistance at $400 on the hourly chart (data feed from Kraken) of BCH/USD.
• The price may decline further in the short term, but the $350 level is a decent support.
Bitcoin cash price started a downtrend against the US Dollar. BCH/USD is trading below $400 and struggling to gains bids.
Bitcoin Cash Price Resistance
Yesterday, we saw a break below a major bullish trend line at $460-450 on the hourly chart of Bitcoin cash price vs the US Dollar. Later, the price corrected higher towards $580. However, the upside move faced sellers and the price moved down below $500. The failure was from the 50% Fib retracement level of the last decline from the $811.00 high to $303.00 low.
The price is currently moving lower and trading below $500. It has already broke the 50% Fib retracement level of the last wave from the $303.00 low to $583.91 high. So, there are chances of more declines as long as the price is below $500. On the upside, there is a new connecting bearish trend line forming with resistance at $400 on the hourly chart of BCH/USD. Once there is a break below the 76.4% Fib retracement level of the last wave from the $303.00 low to $583.91 high, there can be a test of $350.

On the upside, a clear break and close above $400 would call for a test of $500. In the short term, there can be swing moves between $350-500.
Looking at the technical indicators:
Hourly MACD – The MACD for BCH/USD is currently in the bearish zone and struggling.
Hourly RSI (Relative Strength Index) – The RSI is currently well below the 50 level, and slowly moving lower.
Major Support Level – $350
Major Resistance Level – $400
Useful post, BCC in the next few days will struggle to get that equilibrium it needed.
I think so too
Excellent