Bitcoin Cash Price Support

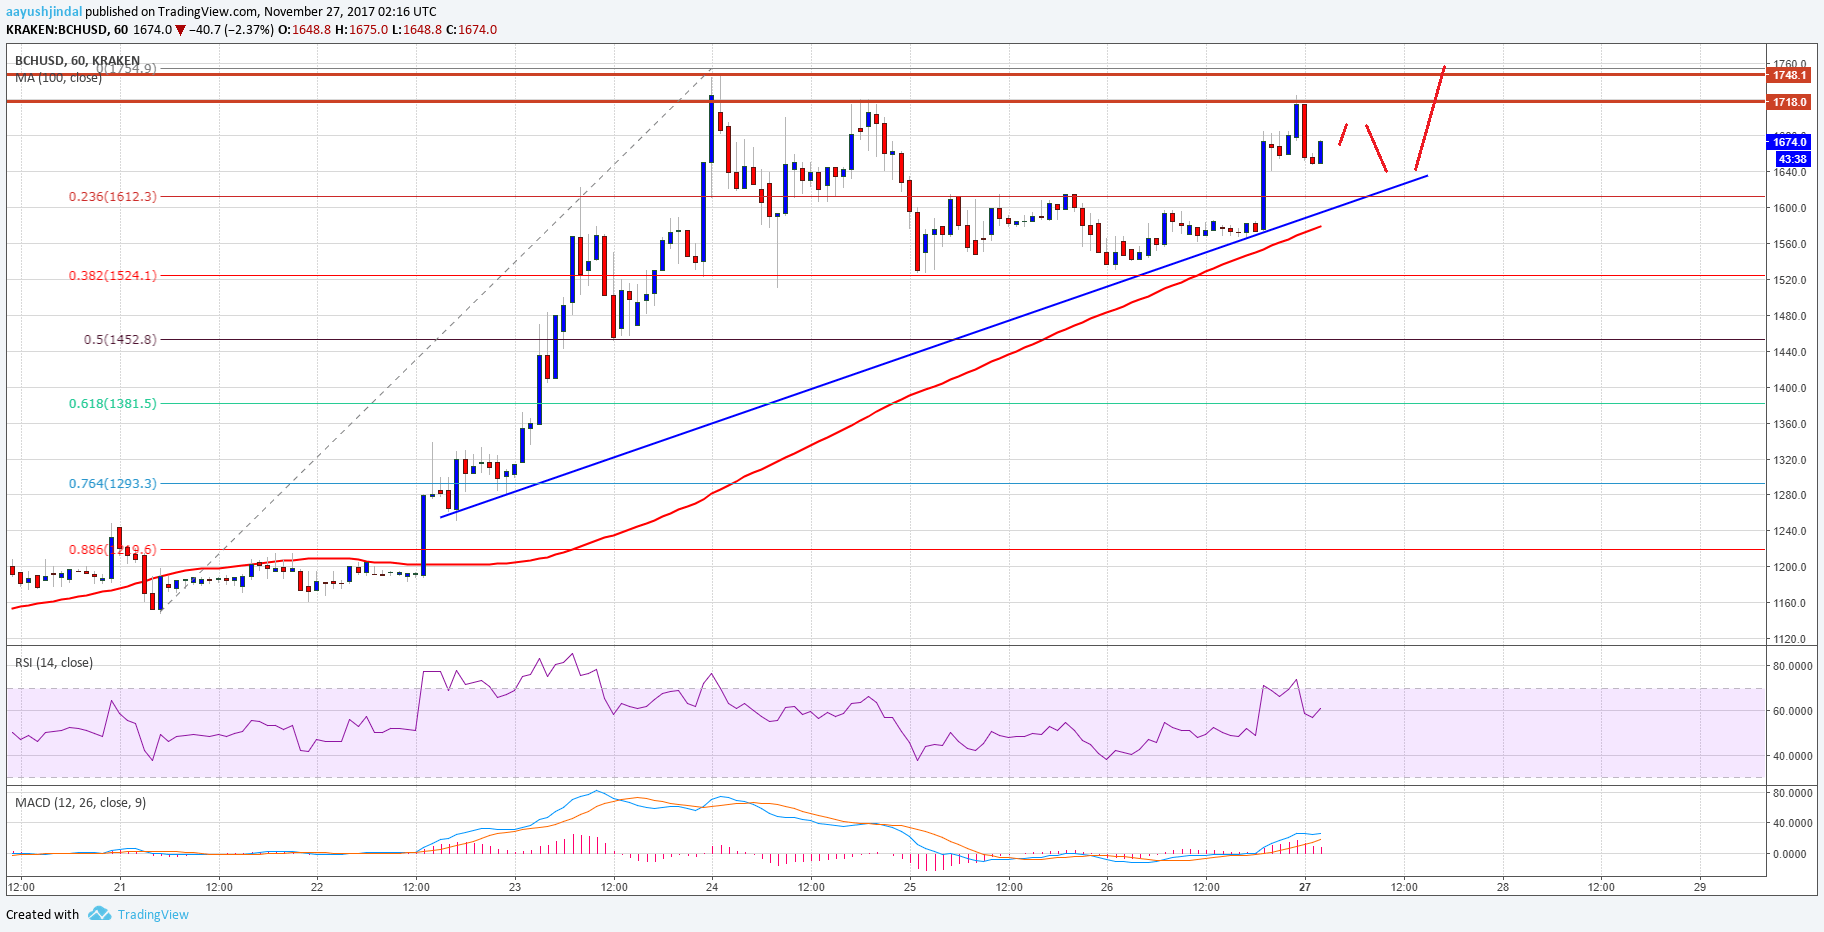
The past few days were mostly bullish for bitcoin cash price as it traded above the $1500 and $1600 resistances against the US Dollar. The price traded above the $1700 level, but struggled to break the $1720 and $1750 resistance levels. There were 2-3 attempts to break the $1750 resistance, but buyers failed. At the moment, the price is correcting lower and it already moved once below the 23.6% Fib retracement level of the last wave from the $1150 low to $1748 high.
However, downsides were limited by the $1520-1500 support zone. Moreover, the 38.2% Fib retracement level of the last wave from the $1150 low to $1748 high also protected declines. On the downside, there is a major bullish trend line forming with support at $1630 on the hourly chart of BCH/USD. The trend line support is likely to prevent declines below $1600 in the near term. There can be a couple of swing moves toward $1620-1600, but at the end the pair would move higher.

A break above the $1750 resistance would open the doors for more gains. The next major hurdle on the upside could be $1800 and $1840. Above $1840, the price might target $2000.
Looking at the technical indicators:
Hourly MACD – The MACD for BCH/USD is nicely in the bullish zone.
Hourly RSI (Relative Strength Index) – The RSI for BCH/USD is well above the 60 level.
Major Support Level – $1600
Major Resistance Level – $1750