Cara Menggambar Grafik Fungsi Aljabar
Cara Menggambar Grafik Fungsi Aljabar
Menggambar Grafik Fungsi Aljabar - Di dalam pelajaran matematika kalian pasti diajarkan mengenai cara- cara menggambarkan grafik fungsi aljabar baik yang berupa garis lurus maupun grafik fungsi aljabar dengan bentuk parabola. Grafik fungsi aljabar yang berbentuk garis lurus dinyatakan dengan persamaan fungsi linear y = f(x) = mx + n sedangkan grafik fungsi yang berbentuk parabola dinyatakan dalam persamaan fungsi kuadrat y = f(x) = ax2 + bx + c.
Catatan:
Gambar dan grafik fungsi y = f(x) disebut kurva y = f(x). Untuk selanjutnya kita akan sering menggunakan istilah kurva.
Di dalam materi kali ini, Rumus Matematika Dasar akan mengajarkan cara-cara menggambarkan kurva yang dinyatakan dengan persamaan fungsi suku banyak. Fungsi sukubanyak adala suatu fungsi dengan peubah (variabel) x yang memupnyai pangkat lebih dari dua. Berikut adala beberapa contohnya:
y = f(x) = x3 + 4x2 - 16x + 2
y = f(x) = x4 + 3x3 - 12x2 - 10x + 5
y = f(x) = 2x5 - 10x4 + 2x3 + 3x2 + 15x + 6 ...... dan seterusnya.
Kurva-kurva yang dinyatakan dengan persaaan fungsi sukubanyak disebut sebagai kurva sukubanyak.
Di dalam penerapannya, kemampuan menggambar kurva sukubanyak ini merupakan modal dasar untuk mempelajari kalkulus hitung integral, misalnya untuk menghitung luas daerah yang dibatasi oleh suatu kurva sukubanyak dengan sumbu X, dan sebagainya.
Beberapa pengertian tentang fungsi naik, fungsi turun, titik balik maksimum, titik balik minimum, titik belok horisontal, serta titik-titik potong dengan sumbu-sumbu koordinat akan sangat membantu dalam menyelesaikan gambar suatu kurva suku banyak. Sebagai pedoman, berikut ini adalah langkah-langkah yang dapat kalian ikuti tentunya untuk bisa menggambarkan suatu kurva sukubanyak.
Langkah-langkah untuk Menggambar Grafik Fungsi Aljabar
Langkah Pertama
Buatlah terlebih dahulu analisis pendahuluan yang meliputi:
Menentukan koordinat titik-titik potong kurva dengan sumbu-sumbu koordinat (jika koordinat itu mudah ditentukan).
         (i) titik potong dengan sumbu X, dengan mengambil syarat y = 0
        (ii) titik potong dengan sumbu Y, dengan mengambil syarat x = 0
Tentukan interval-interval ketika fungsi itu naik dan ketika fungsi itu turun.
Tentukan titik-titik stationer serta jenisnya : titik balik maksimum, titik balik minimum, atau titik belok horisontal.
Tentukan nilai-nilai fungsi pada ujung-ujung interval. Jika kurva itu akan digambarkan untuk semua bilangan real, maka perlu ditantukan nilai-nilai y untuk nilai x yang besar positif dan untuk nilai x yang besar negatif.
Tentukanlah beberapa titik tertentu untuk memperhalus sketsa kurva.
Langkah Kedua
Dari langkah pertama, titik-titik yang didapat kita sajikan dalam bidang cartesius.
Langkah Ketiga
Titik-titik yang telah disajikan dalam bidang Cartesius pada langkah kedua, kemudian kita hubungkan dengan mempertimbangkan naik atau turunnya fungsi. Dengan demikian, kita akan mendapatkan kurva y = f(x)
Agar kalian lebih mudah dan terampil dalam memahami cara menggambar kurva sukubanyak dengan persamaan y = f(x) maka sebaiknya perhatikan contoh di bawah ini:
Soal
Gambarlah sketsa kurva sukubanyak yang ditentukan dengan persamaan y = f(x) = 4x – x3
Cara Menjawabnya:
Langkah Pertama
(a) Koordinat titik-titik potong dengan sumbu-sumbu koordinat.
(i) titik potong dengan sumbu X, dengan mengambil y = 0
4x – x3 = 0
è x(4 – x2) = 0
è x (2 + x) (2 – x) = 0
è x1 = -2 atau x2 = 0 atau x3 = 2
Titik-titik potong dengan sumbu X adalah (-2, 0) (0, 0), dan (2, 0)
(ii) Titik potong dengan sumbu Y, dengan mengambil x = 0 diperoleh:
Y = 4(0) – (0)3 = 0
Titik potong sumbu Y adalah (0, 0)
(b) Dari f(x) = 4x – x3 maka f’(x) 4 – 3x2
              f(x) naik jika f’(x) > 0                     ||             f(x) turun jika f’(x) < 0
                            4 – 3x2 > 0                      ||                           4 – 3x2 < 0
è 3x2 < 4 || à 3x2 > 4
è -2/3 √3 < x < 2/3 √3 || à x < -2/3 √3 atau x > 2/3 √3
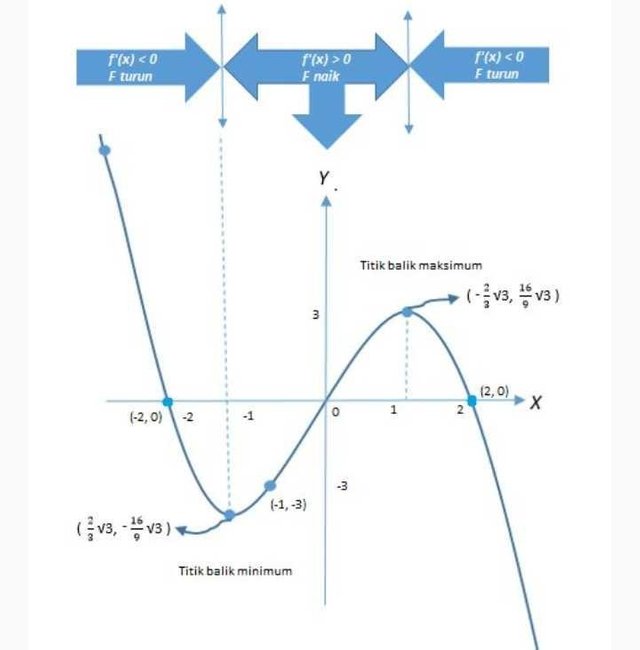
Perhatikan diagram tanda f’(x) pada gambar berikut ini:
(c) Nilai stationer dan jenisnya
            Nilai stationer dicapai apabila f’(x) = 0

            4 – 3x2 > 0
à x1 = -2/3 √3 atau x2 = 2/3 √3
Nilai-nilai stationernya:
Untuk x1 = -2/3 √3 à f(-2/3 √3) = 4(-2/3 √3) – (-2/3 √3)3 = - 16/9 √3
f(-2/3 √3) = - 16/9 √3 merupakan nilai balik minimum, sebab f’(x) berubah tanda dari negatif menjadi positif ketika melewati x =-2/3 √3
Untuk x2= 2/3 √3 à f(2/3 √3) = 4(2/3 √3) – (2/3 √3)3 = 16/9 √3
f(-2/3 √3) = 16/9 √3 merupakan nilai balik maksimum, sebab f’(x) berubah tanda dari positifmenjadi negatif ketika melewati x = 2/3 √3
Jadi titik balik maksimumnya (2/3 √3), 16/9 √3) dan titik balik minimumnya (-2/3 √3), -16/9 √3)
(d) Untuk x besar maka y = f(x) = 4x – x3 dekat dengan -x3
Jika x besar positif, maka y besar negatif
Jika y besar negatif maka x besar positif
(e) Ambil beberapa titik tertentu untuk memperbaiki sketsa kurva.
            x = -3 à y = f(-3) = 4(-3) – (-3)3 = 15 à (-3, 15)
            x = -1 à y = f(-1) = 4(-1) – (-1)3 = -3 à (-1, -3)
            x = 1 à y = f(1) = 4(1) – (1)3 = 3 à (1, 3)
            x = 3 à y = f(3) = 4(3) – (3)3 = 15 à (3, 15)
Langkah Kedua
Beberapa titik yang diperoleh pada langkah pertama diletakkan pada bidang kartesius.
Langkah Ketiga
Titik-titik yang telah disajikan pada bidang kartesius itu kemudian dihubungkan untuk memperoleh sketsa kurva yang mulus seperti pada gambar dibawah ini:
Dalam hal ini perlu juga diperhatikan pula naik turunnya fungsi pada interval-interval yang telah ditentukan pada langkah 1 bagian (b)
Demikianlah penjelasan tata Cara Menggambar Grafik Fungsi Aljabar lengkap dengan contoh soal dan penjelasan langkah-langkahnya. Semoga kalian bisa mengerti dan menerapkannya dengan baik.
How to Draw a Graph of Algebra Functions
Drawing a Graph of Algebra Functions - In your math lessons you will be taught how to describe graphs of algebraic functions in both straight lines and graphs of algebraic functions with parabolic shapes. The graph of a straight-line algebraic function is expressed by the linear function equation y = f (x) = mx + n while the parabolic function graph is expressed in the quadratic function equation y = f (x) = ax2 + bx + c.
Note:
Figures and function graphs y = f (x) are called curves y = f (x). For the next we will often use the term curve.
In the material this time, the Basic Mathematical Formulas will teach ways of describing the curves expressed by the equations of many tribal functions. The function of sukubanyak is a function with the variable (variable) x which memupnyai rank of more than two. Here are some examples:
y = f (x) = x3 + 4x2 - 16x + 2
y = f (x) = x4 + 3x3 - 12x2 - 10x + 5
y = f (x) = 2x5 - 10x4 + 2x3 + 3x2 + 15x + 6 ...... and so on.
The curves expressed by means of the sukubanyak function are referred to as the sukubanyak curves.
In its application, the ability to draw these sukubanyak curves is the basic capital for studying integral calculus calculations, for example to calculate the area of a region bounded by a Sukuk curve with the X axis, and so on.
Some notions of increased functionality, descending function, maximum turning point, minimum turning point, horizontal turning point, and cutting points with coordinate axes will be helpful in completing the image of a large tribal curve. As a guide, here are the steps you can follow, of course, to illustrate a sukubanyak curve.
Steps for Drawing a Graph of Algebra Functions
The first step
Prepare a preliminary analysis that includes:
Determine the coordinates of the curve cut points with the coordinate axes (if the coordinates are easily determined).
         (i) the intersection with X axis, by taking the condition y = 0
        (ii) the point of intersection with the Y axis, taking the condition x = 0
Determine the intervals when the function is up and when the function is down.
Determine the stationary points and their type: maximum turning point, minimum turning point, or horizontal turning point.
Determine the function values at the ends of the interval. If the curve is to be drawn for all real numbers, then we need to assign the y values to a large positive x and for a large negative x.
Determine certain points to refine the curve sketch.
Step Two
From the first step, the points we get are presented in the field of cartesius.
Third step
The points that have been presented in Cartesius field in the second step, then we connect by considering the rise or fall of function. Thus, we will get curves y = f (x)
To make it easier and skillful to understand how to draw a sukubanyak curve with the equation y = f (x) then you should consider the example below:
Question
Draw the sketch of the sukubanyak curve determined by the equation y = f (x) = 4x - x3
How to answer it:
The first step
(a) Coordinate the points of intersection with the coordinate axes.
(i) the intersection with X axis, taking y = 0
4x - x3 = 0
è x (4 - x2) = 0
è x (2 + x) (2 - x) = 0
è x1 = -2 or x2 = 0 or x3 = 2
The points of intersection with the X axis are (-2, 0) (0, 0), and (2, 0)
(ii) The intersection with the Y axis, taking x = 0 is obtained:
Y = 4 (0) - (0) 3 = 0
The cut off point of Y axis is (0, 0)
(b) From f (x) = 4x - x3 then f '(x) 4 - 3x2
              f (x) rises if f '(x)> 0 || f (x) falls if f '(x) <0
                            4 - 3x2> 0 || 4 - 3x2 <0
è 3x2 <4 || à 3x2> 4
è -2/3 √3 <x <2/3 √3 || à x <-2/3 √3 or x> 2/3 √3
Notice the f '(x) sign diagram in the following figure:
(c) Stationer value and type
            The stationary value is reached when f '(x) = 0

            4 - 3x2> 0
à x1 = -2/3 √3 or x2 = 2/3 √3
Stationer values:
For x1 = -2/3 √3 à f (-2/3 √3) = 4 (-2/3 √3) - (-2/3 √3) 3 = - 16/9 √3
f (-2/3 √3) = - 16/9 √3 is the minimum return value, because f '(x) changes the sign from negative to positive when passing x = -2 / 3 √3
For x2 = 2/3 √3 à f (2/3 √3) = 4 (2/3 √3) - (2/3 √3) 3 = 16/9 √3
f (-2/3 √3) = 16/9 √3 is the maximum return value, because f '(x) changes the sign from positive to negative as it passes x = 2/3 √3
So its maximum turning point (2/3 √3), 16/9 √3) and its minimum turning point (-2/3 √3), -16/9 √3)
(d) For large x then y = f (x) = 4x - x3 is close to -x3
IfIf x is big positive, then y big negative
If y is big negative then x big positive
(e) Take some point to correct the curve sketch.
            x = -3 à y = f (-3) = 4 (-3) - (-3) 3 = 15 à (-3, 15)
            x = -1 à y = f (-1) = 4 (-1) - (-1) 3 = -3 à (-1, -3)
            x = 1 à y = f (1) = 4 (1) - (1) 3 = 3 à (1, 3)
            x = 3 à y = f (3) = 4 (3) - (3) 3 = 15 à (3, 15)
Step Two
Some points obtained in the first step are placed on the Cartesian plane.
Third step
The points that have been presented in the area of Cartesian are then connected to obtain a smooth curve sketch like in the picture below:
In this case it is also necessary to note also the rise and fall of function at the intervals that have been determined in step 1 part (b)
Such is the explanation of the Graphics Algebra Function Drawing procedure complete with examples of problems and explanations of the steps. Hope you guys can understand and apply it well.
Congratulations! This post has been upvoted from the communal account, @minnowsupport, by Riskimauliza from the Minnow Support Project. It's a witness project run by aggroed, ausbitbank, teamsteem, theprophet0, someguy123, neoxian, followbtcnews, and netuoso. The goal is to help Steemit grow by supporting Minnows. Please find us at the Peace, Abundance, and Liberty Network (PALnet) Discord Channel. It's a completely public and open space to all members of the Steemit community who voluntarily choose to be there.
If you would like to delegate to the Minnow Support Project you can do so by clicking on the following links: 50SP, 100SP, 250SP, 500SP, 1000SP, 5000SP.
Be sure to leave at least 50SP undelegated on your account.
Resteemed your article. This article was resteemed because you are part of the New Steemians project. You can learn more about it here: https://steemit.com/introduceyourself/@gaman/new-steemians-project-launch