Technical analysis for Antshares ANS (02.07.17)
Technical analysis for Antshares ANS (02.07.17)
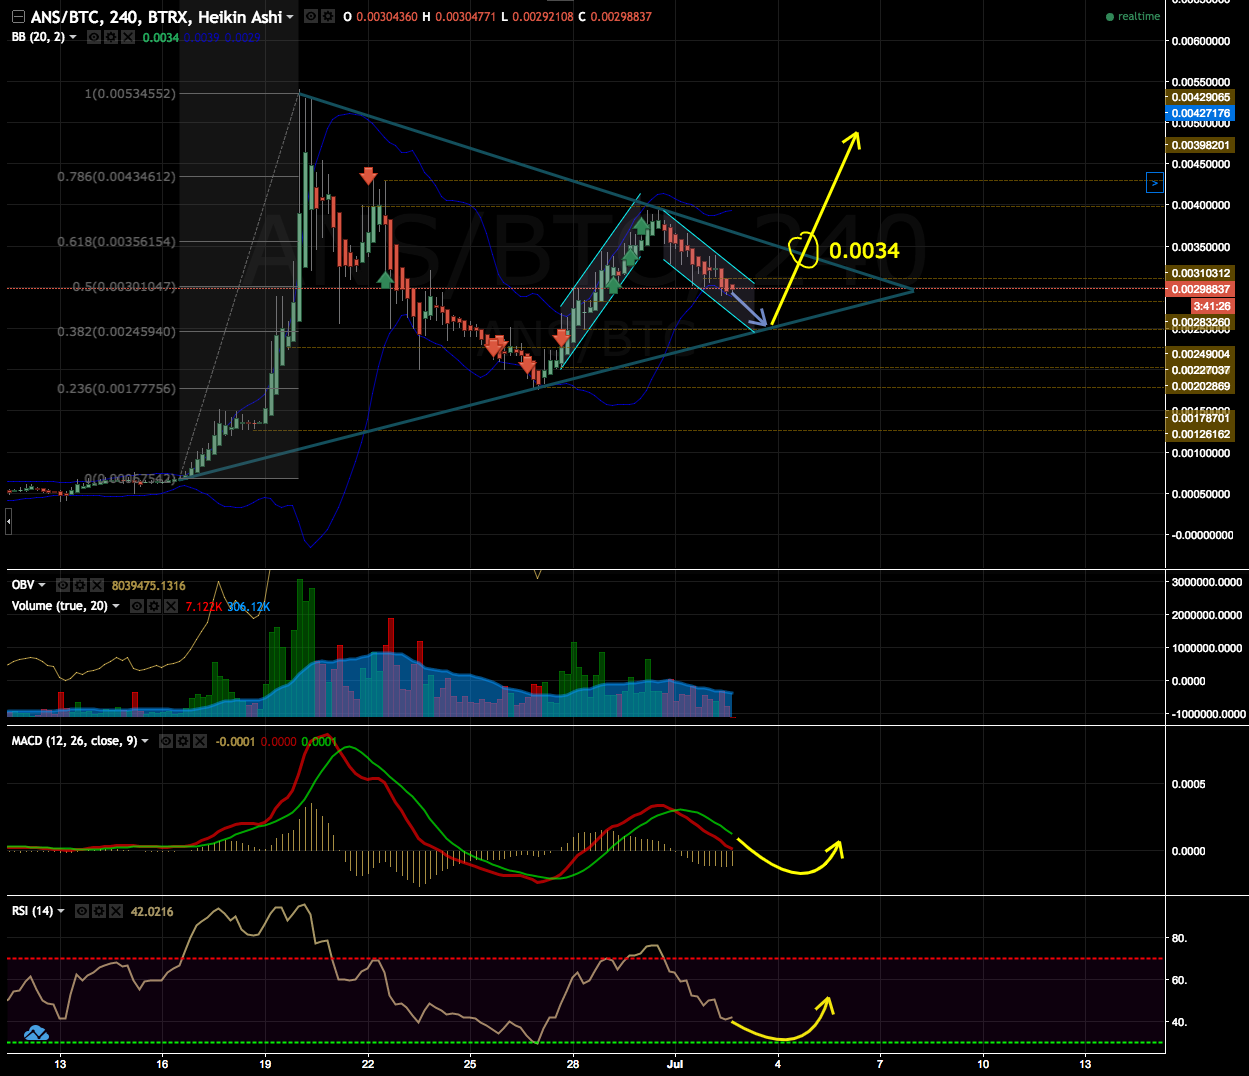
Pennant pattern
Antshares saw a massive increase of its price between 16 and 20 June. Its price sky rocketed from 0.00060 btc to 0.0054 btc. This massive increase has been followed by a quite severe correction, touching 0.0018 btc. Since ANS has rebounded to 0.0039 btc to form a classic pennant pattern.
Where to from here?
ANS price is currently at 0.0031 btc. We expect the short-term downtrend to continue until ANS reaches 0.0025 btc in the next 24 hours. From this point, we expect a rebound and ANS will hopefully break the top section of the triangle/pattern, breaking its resistance and travelling back to its all-time high.
Other indicators
The OBV is still increasing showing that ANS is not being massively dropped by investors.
The RSI is travelling south, which is expected in the current downtrend.
The MACD is forming nice up and down waves, consistently with the pennant pattern.
If you would like to share your views or make any suggestion about the above analysis, please use the comment box below.
Time will tell, but yes it reads quite well. I did pick up a typo... "Antarshares"
Fixed, thanks @epitome :)
Great analysis. Thanks for sharing!
You're welcome. We are not far from 0.0034 now. Currently at 0.00321 :)
Very interesting