how to analyze using classic indicators for beginners
There are two types of technical indicators based on the times of classical indicators and modern indicators.
The classical indicator is a simple indicator that its use is manually or without complicated calculations. While the modern indicators are indicators that use more complex calculations that can only be done computerized. Most modern indicators are the development of classical indicators or the incorporation of several indicators.
Examples are Moving averages, trend lines and support and resistance lines
Here's how to use classic indicators to predict market direction:
- Predict using a moving average.
Moving averages are a reflection of the average price of a period. The rules of the game when the price is now above the average then called the up trend. And when the price is now below the average is called the downtrend.
But if we wait for such conditions to happen then we are late if at that time we enter the market. In order not to late we must identify the start of a trend with a moving average.
The ascending trend is indicated by the MA line (moving average) which cuts the graph from above.
The down trend is indicated by the MA line (moving average) which cuts the graph from the bottom
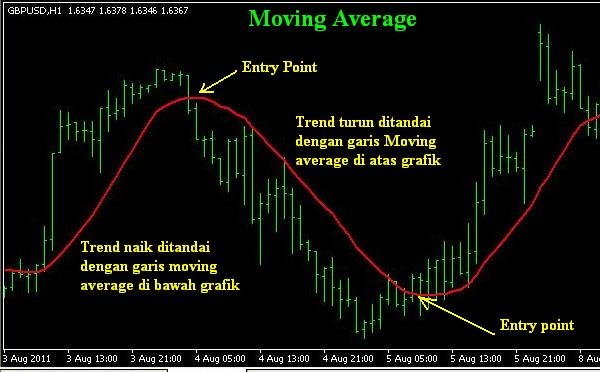
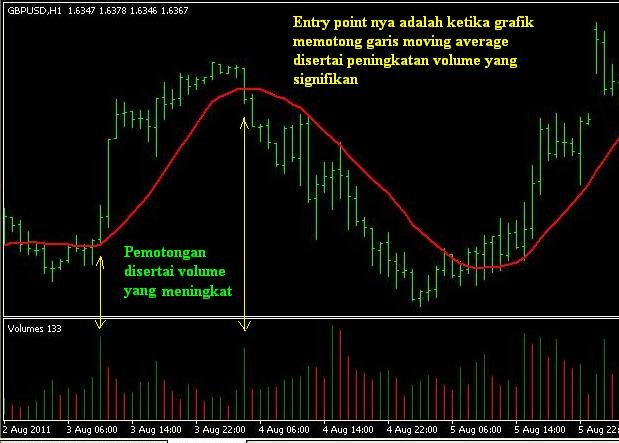
There are 2 options that are used for the entry point:
a. When the graph intersects the MA line with the enlarged volume
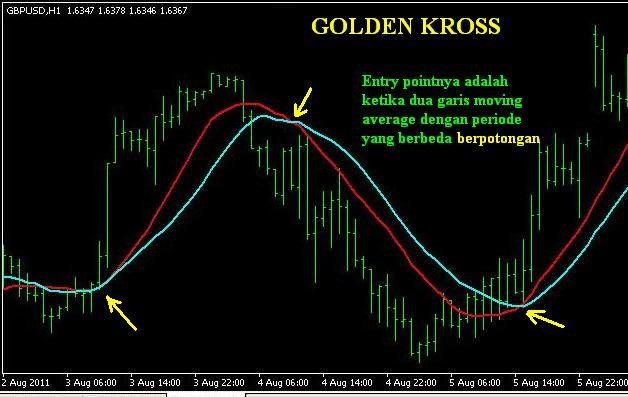
b. When two moving average lines are different periods intersect
- Predicting the direction of the market using trend line, support and resistance
Trendline, support and resistance is a line. But it has a different fung si.
Trendline serves as a barrier to a trend. If trend line ditembu, then the trend will reverse direction.
The Support line serves as the lower bounding wall which will reflect the price back up. But if successfully penetrated then the price will continue to fall.
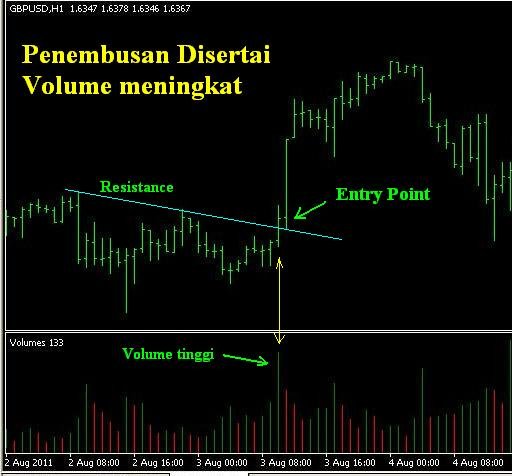
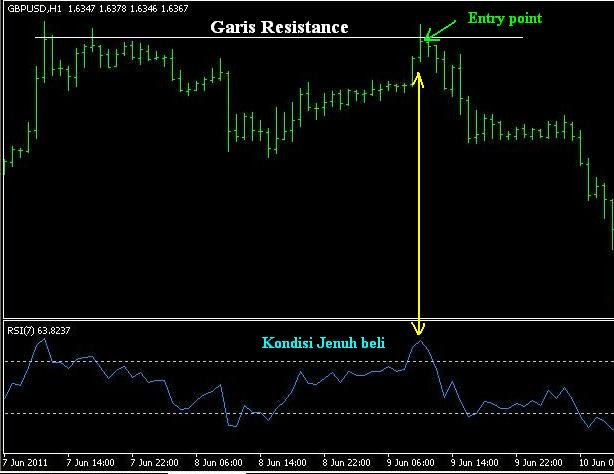
The resistence line serves as a barrier to the top to reflect the price back down. However, if the price is broken then the price will continue to rise.
Rules of play:
If all three lines are broken, then the price will continue to move further. But if it fails to break it, the price will reverse direction.
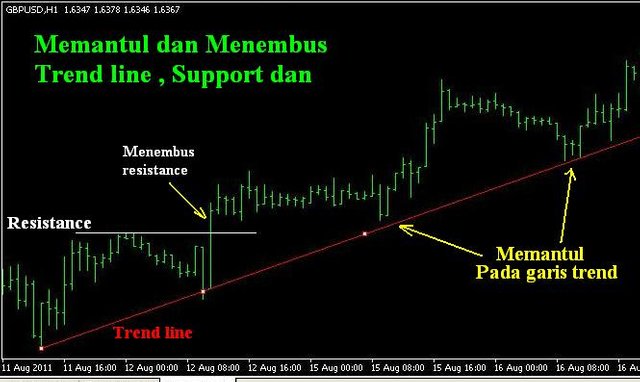
Entry point is:
- When penetrating trend line, support or resistance accompanied by big volume
- When the price is around trend line, support or resistance, and market condition is overbought or oversold
You have a minor misspelling in the following sentence:
It should be resistance instead of resistence.thx for notice me