ETH WEEKLY ANALYSIS ETH/USD REMAINS PRESSURED
Key Highlights
ETH price continued to face sellers and failed to close above $300 against the US Dollar.
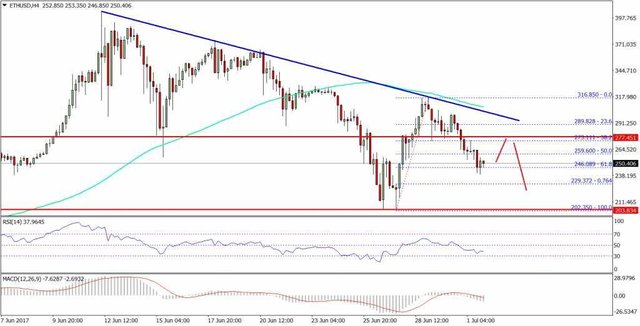
There is a crucial bearish trend line forming with current resistance as $288 on the 4-hours chart of ETH/USD (data feed via SimpleFX).
The pair is likely to continue moving lower and retest the last swing low of $230 if sellers remain in control.
Ethereum price is struggling to gain momentum against the US Dollar and Bitcoin, and ETH/USD may now decline back towards the previous support.
Ethereum Price Resistance

There was a sharp decline in ETH price towards the $200 handle recently against the US Dollar. The price traded as low as $230 where there was a solid buying interest. The price started a recovery and moved sharply higher. It traded above the $250 and $300 resistances. A high was formed at $316 where sellers defended further gains and prevented a break above $320.
A crucial bearish trend line forming with current resistance as $288 on the 4-hours chart of ETH/USD acted as a barrier. Moreover, the 100 simple moving average on the same chart prevented a close above $300. As a result, the price started declining once more, and traded below $300. It broke the 50% Fib retracement level of the last wave from the $202 low to $316 high. During the downside, the price also cleared the $277 support.
At the moment, it is trading near the 61.8% Fib retracement level of the last wave from the $202 low to $316 high. There are chances of further declines if buyers fail to hold $250. A close below $240 could ignite a sharp downside move towards the next major support at $203.
4-hours MACD – The MACD is gaining pace in the bearish zone and signaling declines.
4-hours RSI – The RSI is now well below the 50 level and heading lower.
Major Support Level – $285.00
Major Resistance Level – $330.00
Charts courtesy – SimpleFX
Great work ma. Keep it up!! I will suggest you write a long article on this topic to provide in-depth information.