Coronavirus Analysis - Update - 31 March 2020
An update to the numbers I have put out in the coronavirus analysis so far, taking into account the extra data up to the end of today (UK time).
All figures sourced from wikipedia. See the individual analyses for links to the exact pages.
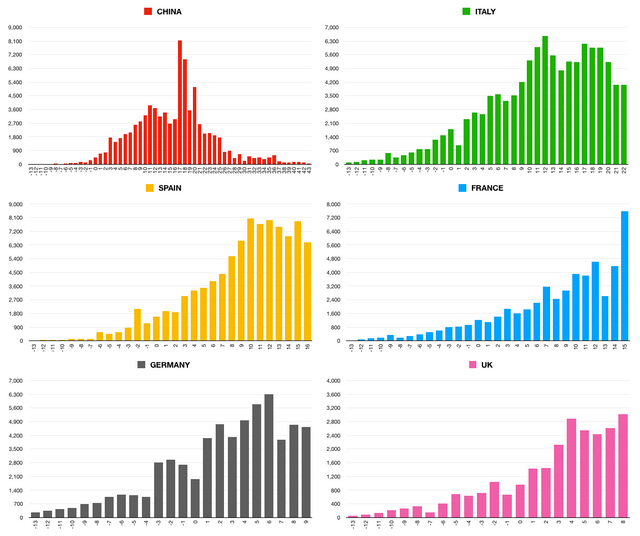
New coronavirus cases by date
Day 0 on the x-axis is the date of lockdown in each country, negative numbers are days before the lockdown, positive numbers count days through the lockdown.

Italy and Spain appear to have passed the maximum number of new cases per day and are starting to see reductions.
For the UK and Germany there is a flattening of new case numbers, possibly even a reduction in the case of Germany, although for both countries it is still too early in the lockdown to be certain.
France numbers are all over the shop; a big spike today which could be (a) a catch up in case numbers from the week-end (b) a change to wider testing (c) a later spreading of the outbreak into a new population (d) a failure of the lockdown. One to keep an eye on over the next few days.
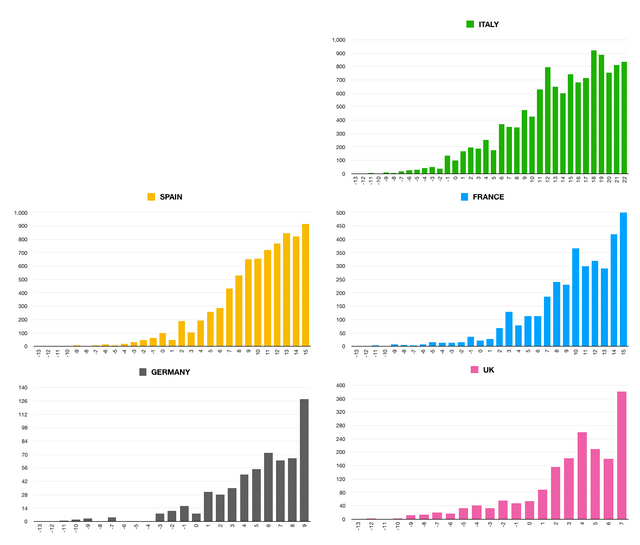
Coronavirus deaths by date
Coronavirus deaths by date. X-axis as for the charts above.

The number of deaths continues to increase even though the number of new cases is decreasing in some countries.
The pattern of the number of deaths will lag the number of new cases by a week or two.
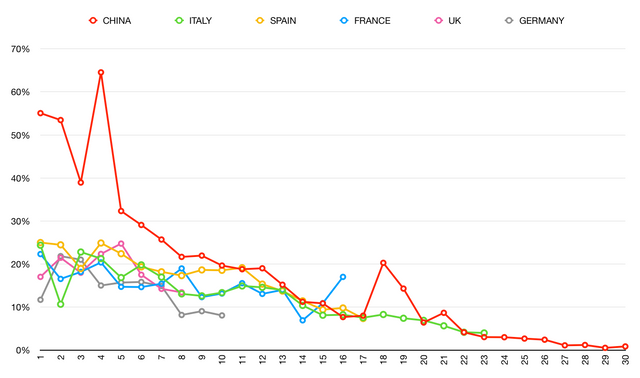
Total case numbers increase rate
An attempt to show how well the lockdown is working in each country by looking at how the rate of increase in total cases slows over time and comparing the pattern to the outbreak in China.

Italy and Spain lockdowns still progressing well. France the data is strange (as for the results above). UK and Germany figures are encouraging, although too early to be certain in the UK.