Bitcoin Price Weekly Analysis: BTC/USD Bearish Below $6,000
Bitcoin Price Trend
This past week, bitcoin price failed to move above the $6,700 and $6,800 resistance levels against the US Dollar. As a result, there was a downside reaction and the BTC/USD pair broke the $6,500 support. The decline got traction and the price even broke the $6,250 support zone. It pushed the price in a bearish zone below $6,250 and the 100 simple moving average (4-hours).
The price even broke the last swing low of $6,128 and formed a new monthly low. It tested the 1.236 Fib extension level of the last wave from the $6,128 low to $6,859 high. Later, there was an upside correction and the price moved above $6,100. However, the upside move was capped by the $6,250 and $6,300 resistance levels, which were supports earlier. At the moment, the price is trading with a bearish angle below $6,250. The next target for sellers could be the 1.618 Fib extension level of the last wave from the $6,128 low to $6,859 high near $5,677.
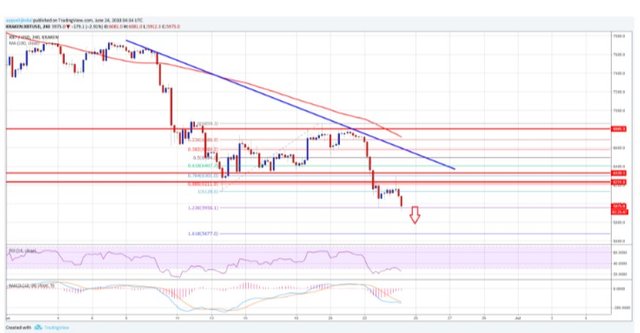
Looking at the chart, the price is currently in a bearish zone below $6,250. There are high chances that bitcoin could extend its decline below $5,800 and $5,700 in the near term. On the upside, resistances are at $6,250 and $6,500.
Looking at the technical indicators:
4-hours MACD – The MACD for BTC/USD is mostly in the bearish zone.
4-hours RSI (Relative Strength Index) – The RSI is now in the oversold zone.
Major Support Level – $5,600
Major Resistance Level – $6,250
follow, upvote, comment please...
Please upvote: https://steemit.com/free/@bible.com/4qcr2i
Please upvote: https://steemit.com/free/@bible.com/4qcr2i