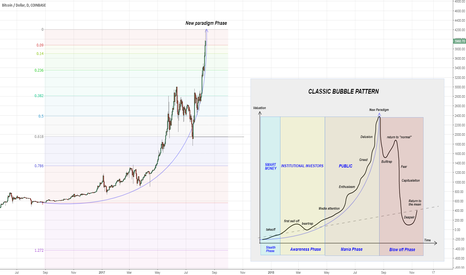
ANALYSING BTC/USD
This graphic of Classic Bubble Pattern, it happen on :
- Oil -0.13% 2008,
- Nasdaq in 2000,
- Chinese Shanghai index in 2007,
- Cotton -0.80% in 2011,
- Waiting list
And in every bubble ended the same way: "they all came back down sharply"
Disclaimer :
This analysis not include personal feeling/opinion, and pure base on technical analysis , and historical data
Trading foreign currencies/cryptocurrency can be a challenging and potentially profitable opportunity for investors. However, before deciding to participate in the Forex market, you should carefully consider your investment objectives, level of experience, and risk appetite. Most importantly, do not invest money you cannot afford to lose.