Unlocking Potential: Dive into the Monthly MACD Chart of Altcoin Market Capitalization
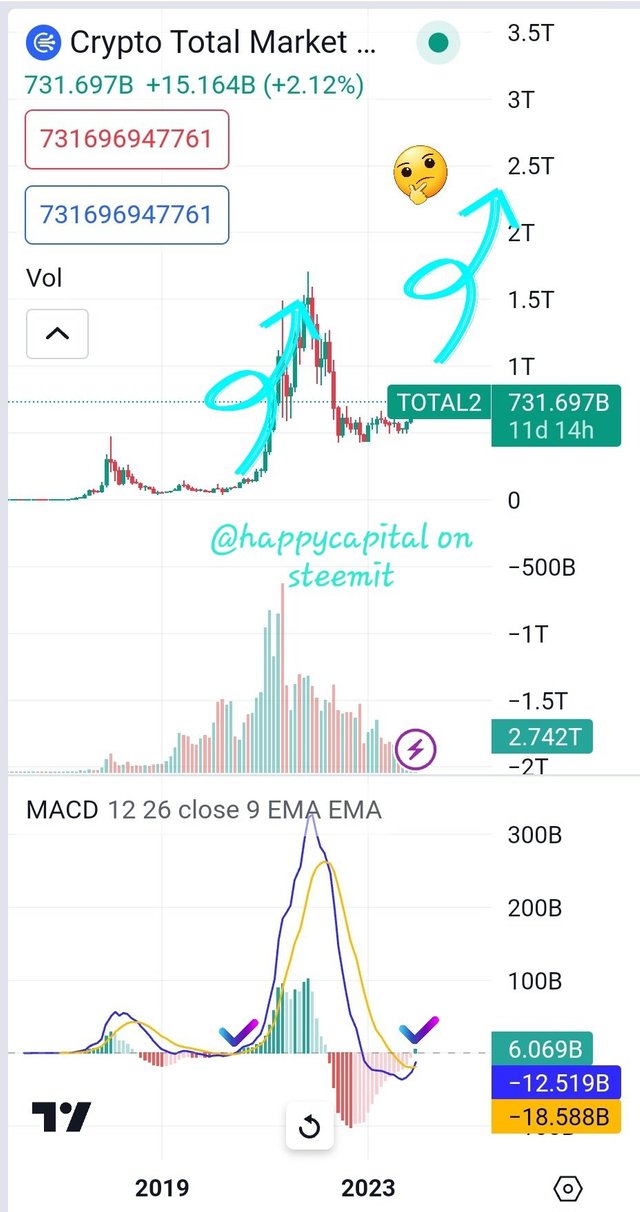
Observing the monthly MACD showcasing a golden cross historically paralleled the altcoin marketcap's surge. Interestingly, with the recent recurrence of this golden cross, a similar uptrend seems to be on the horizon. The sight of a green candlestick on the monthly MACD chart brings a sense of contentment. 🤗
Many altcoins initiated corrections back in April 2021, while others followed suit starting from November 2022. It's been over 2.5 years since these corrections commenced. This extended period of adjustment might just be sufficient to ignite the altcoin market. The market has undergone substantial correction and consolidation phases. Additionally, as we approach BTC's 4th halving and anticipate decisions on spot BTC ETF applications, coupled with the Fed's plans for potential rate cuts next year, indications for 2024 seem more promising than 2023.
The certainty lies in the crypto market's exponential growth, often exceeding our projections. Naturally, internal market challenges like misappropriation, insolvency, and cybersecurity threats may surface. Yet, as history has shown, the market tends to navigate and overcome these hurdles