ANALYZING BTC/USD CRYPTOCURRENCY
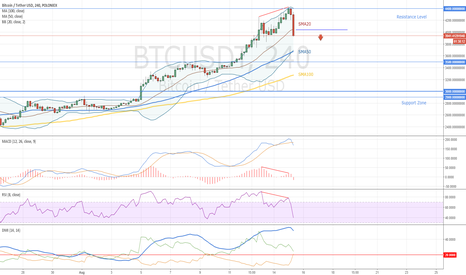
The price diverges with MACD histogram and RSI . We get a bearish divergence which is a strong trend reversal signal. MACD confirms downward movement. RSI confirms price reversal from 4400.00 level. ADX line of DMI -0.34% indicator starts falling. It's a signal that bulls are not so strong now. Based on the above signals, we should expect for a correction movement. The market is going to move lower and we have to spot possible support zones for buying based on reversal signals. If the market drops lower than Simple Moving Average with period 20, it will be a good confirmation of further downward movement. The market will be able to reach SMA50. This support line can stop and reverse the falling market. If we get a confirmed reversal signal from SMA50, we'll be ably to open long trades. But if the market breaks this support line, the next support zones will be at 3500.00 level and then SMA100. These zones will be good for buying and joining to the main uptrend.