AEX breakdown 16-11-2018 Technical Price analysis
AEX
4u AEX:
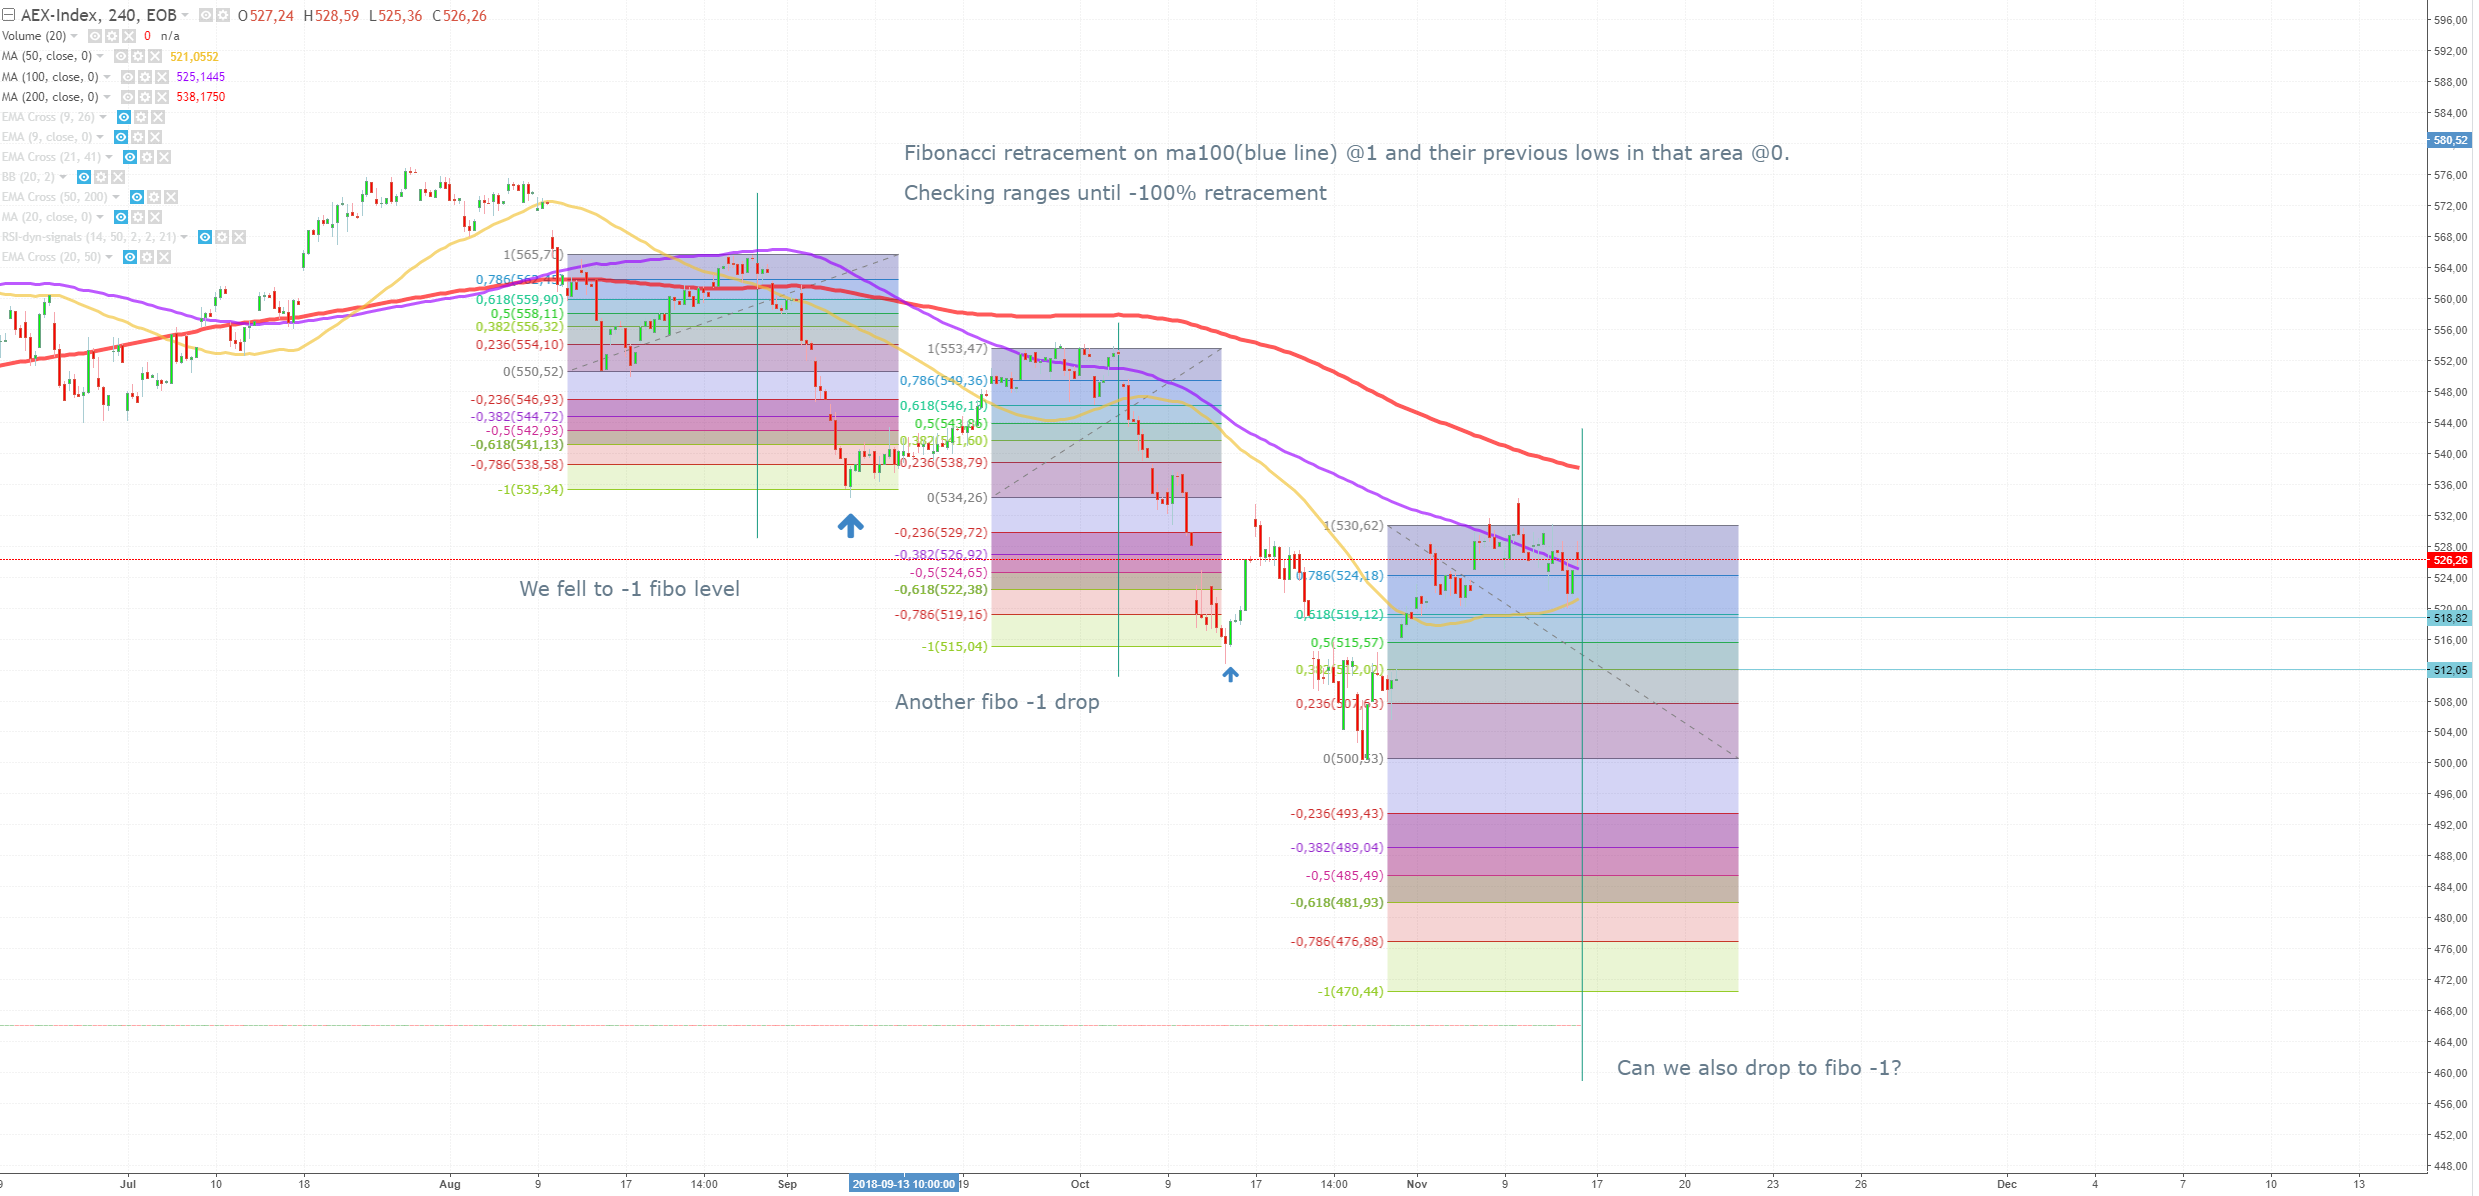
At 4u something strange was happening.
Everytime the market hits the blue line (ma100) we saw an pattern in fibonacci retracement.
Blue line avarage I took as 1. And the lows in that area I gave the 0 point (lowest point) and I retraced downwards information until -100% retracement.
I have an retracement of the absolute top and the avarage top around the ma100 (blue).
This was the -1(-100%) retracement on the abolute top:
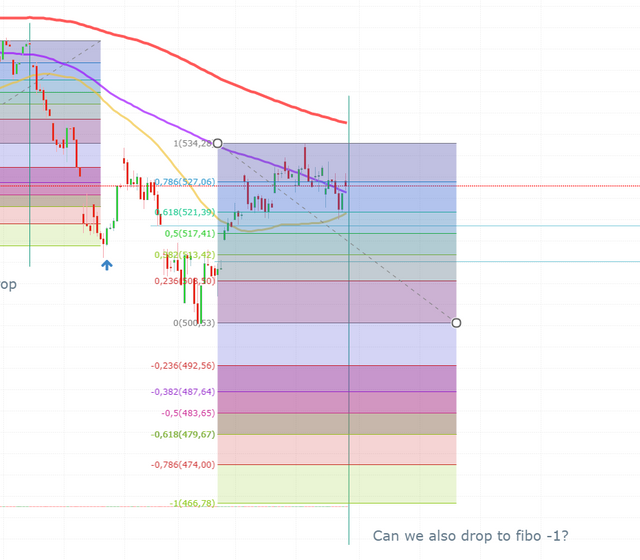
I need to mentiod this small area in between, but it was too tight for a good fibo indicator, so I took the maximum and avarage value's, here are the results:
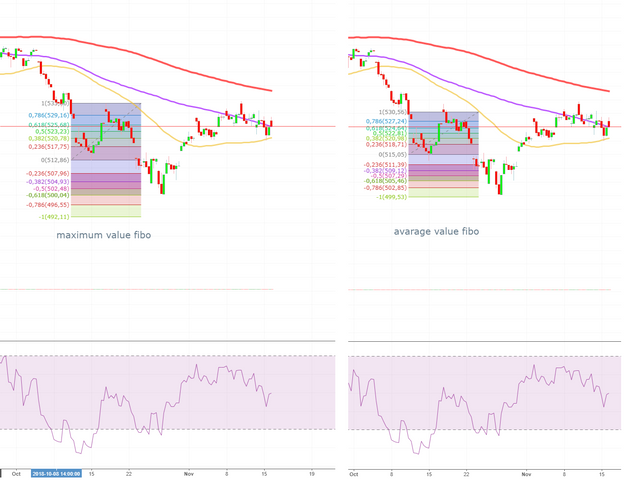
Around -61% - -100% retracement in the in between area.
So around 466 and 470 were given as most extreme retracement points. Remeber these values.
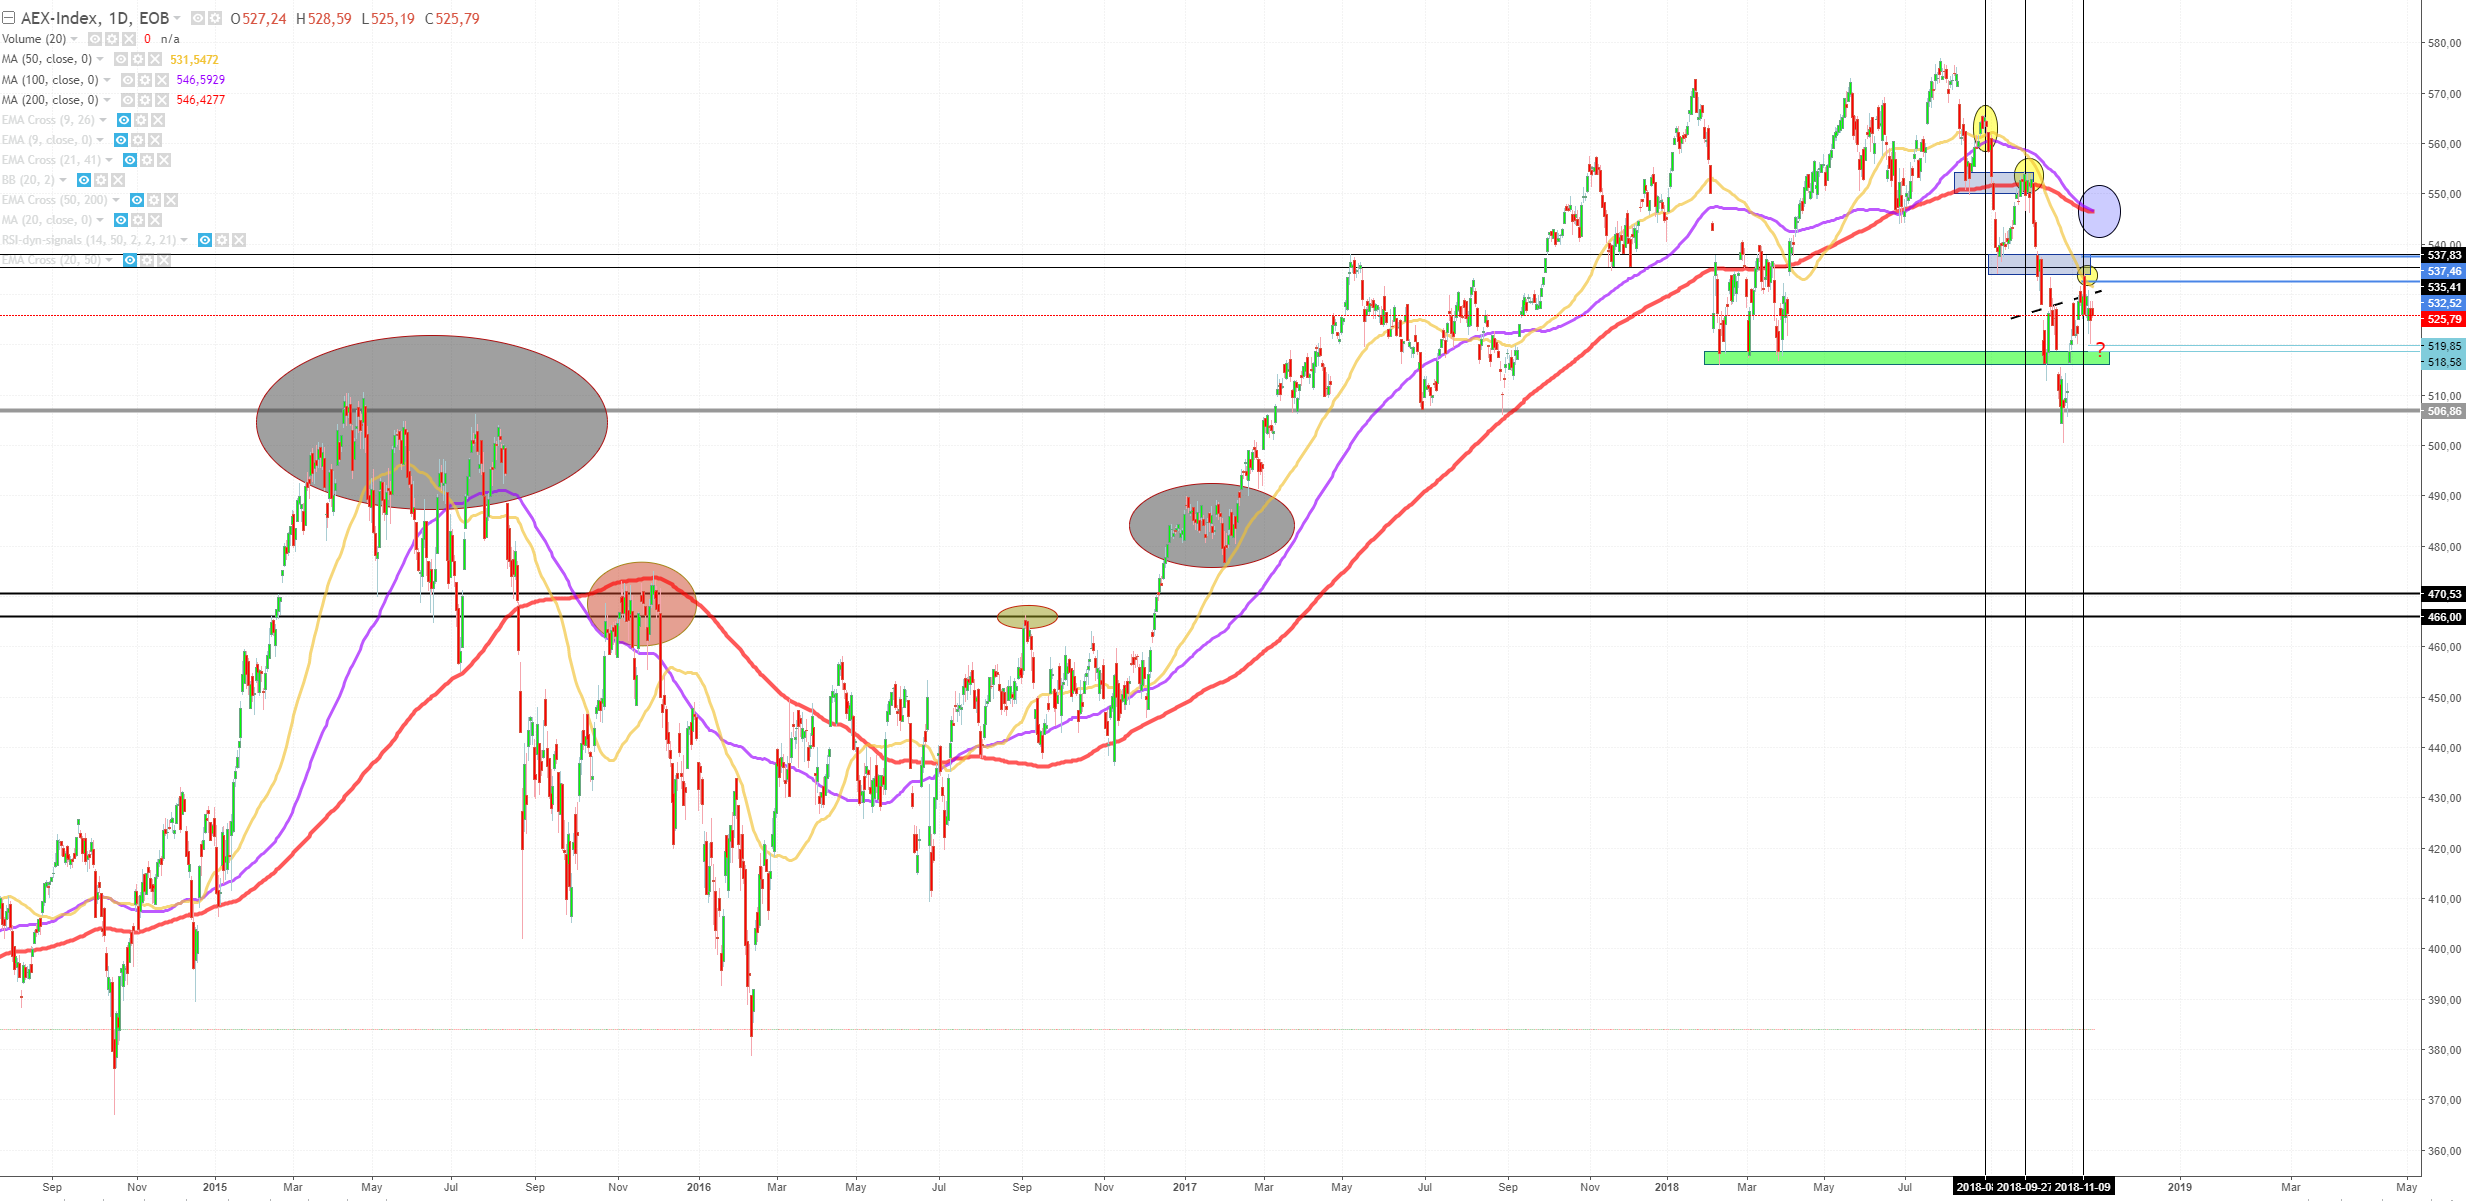
But first I want to show you the day-chart of the AEX:
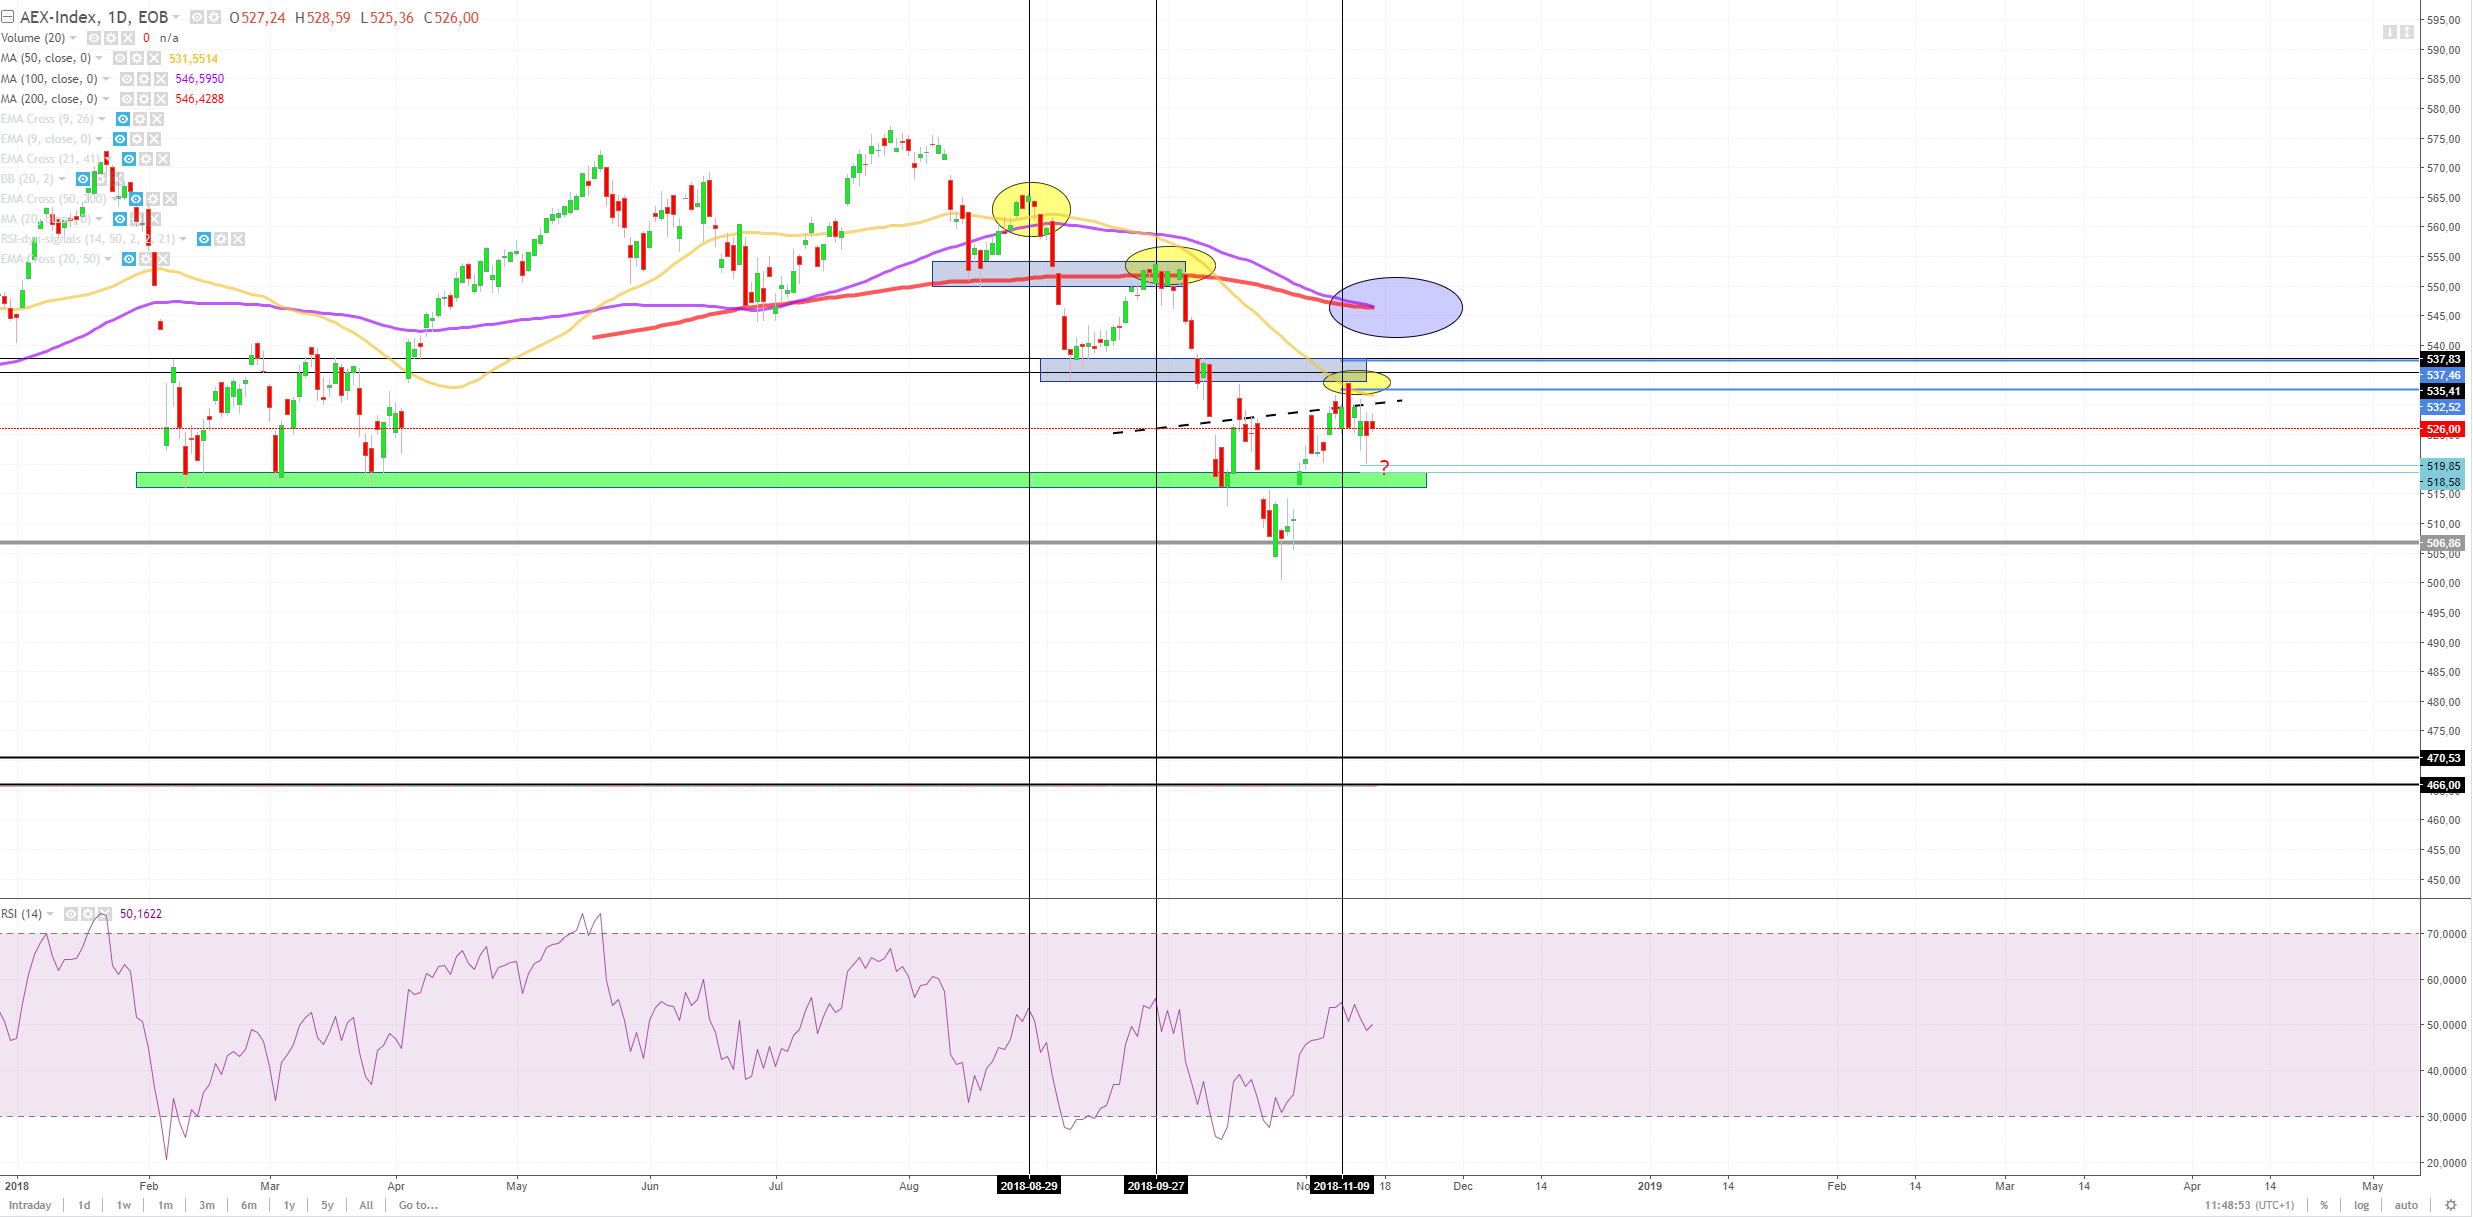
Some interesting area's are seen on the ma50 (yellow line) area's. I draw these with yellow circles. All these circles correspond with previous lows, which has now become tops, indicating a downward trend.
There is also some resemblance with the RSI (underneath in the chart) tops on RSI are around the same height and are dropping each time until now.
Also check the area's and compare them with the 4u chart. The ma50 (yellow line) on this day chart. Shows some equal behavior compared to the ma100(blue line) on previous mentioned 4u chart.
I also have to mention, that on this 1d chart. The ma100 (blue line) is going underneath the ma200(red line) which is a very down-ward signal for a market (ma100<ma200).
Conclusion
It's hard to predict if we are really going to see the 466 - 470 area.
On the day chart we see a lot of resistance. Including an optional inverted Head & shoulders pattern. But we have to remember the ma100<ma200 signal on the daily chart.
Also it's important to mention the end-year rally, we usually see coming, because banks want to gain their bonus/rewards.
You still remember these 466-470 value's:
They showed up around some old top levels.
I think it's unlikely to drop suddenly to this degree. Because there is a lot of support in between, like the green bar area. The gray line underneat (506) and another gray-circle area around 480-490
But some of these value's also correspond with some of the fibonacci value's, some negative and some positive.
If we enter a negative fibonacci value, don't expect an end year run.
If we reverse around a positive fibonacci level we could enter a small run up by the end of the year.