AEX analysis 28-12-2018
Montly chart
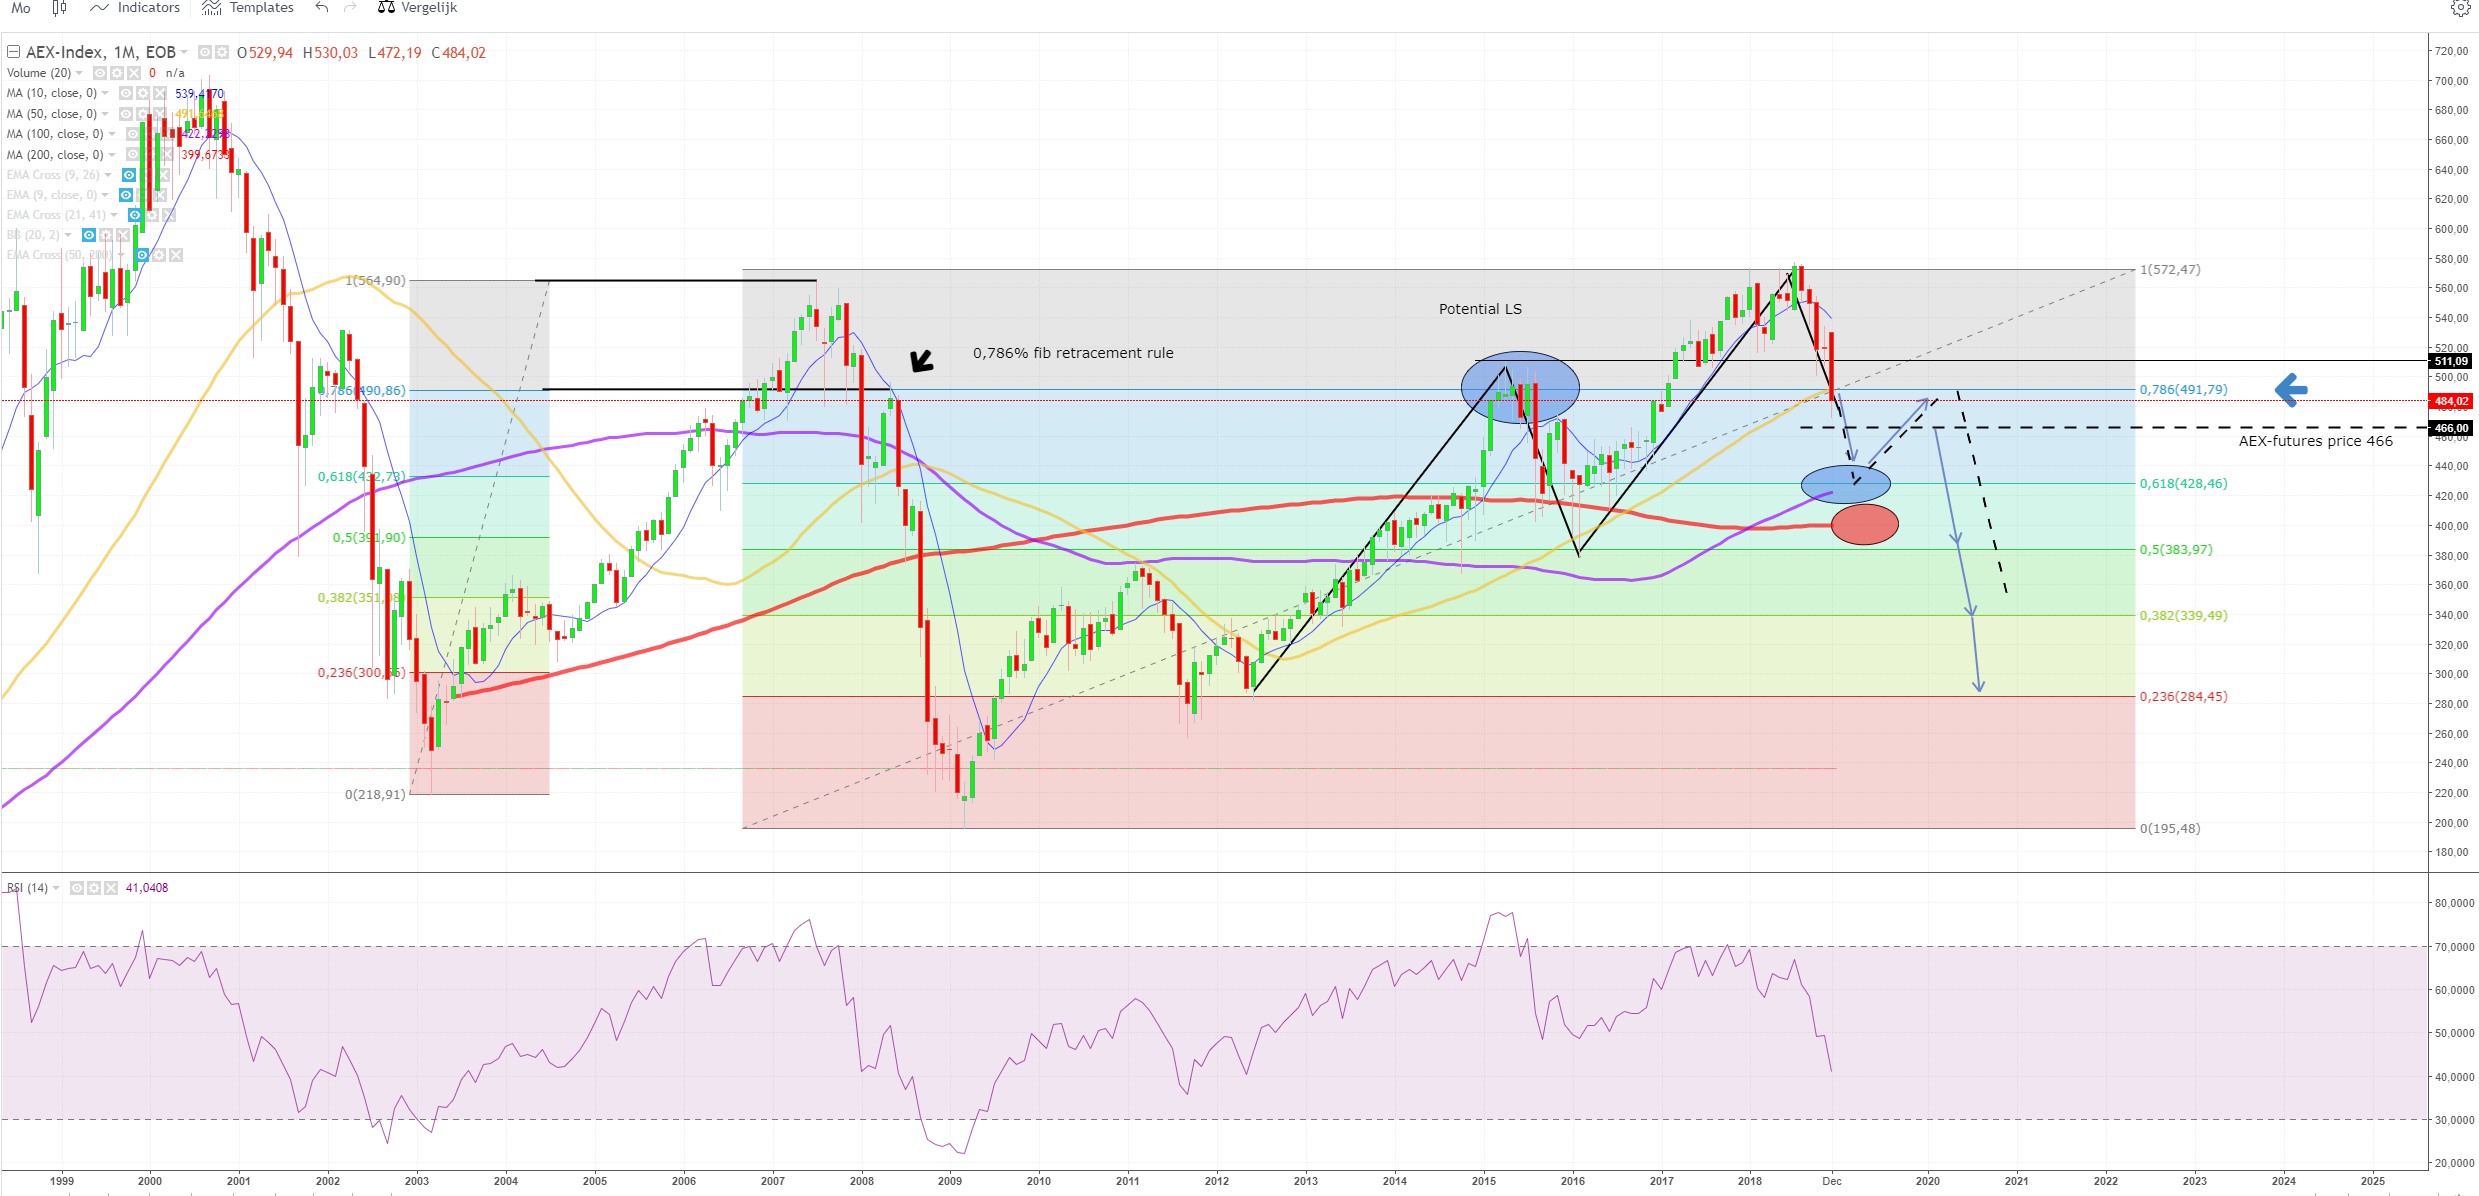
Market did crash end of this year, AEX is closed <ma50 on the monthly chart. Also < fibonacci level. Monthly seems to have a further down next month until the blue or red area near ma100&ma200. (more likely ma100)
With an optional correction we might see a upcoming head & shoulders pattern. Which means we could fall down very hard even <285 or <200 in worst cases.
So be very, very carefull around the 490 - 510 area if we see a correction
1 Week
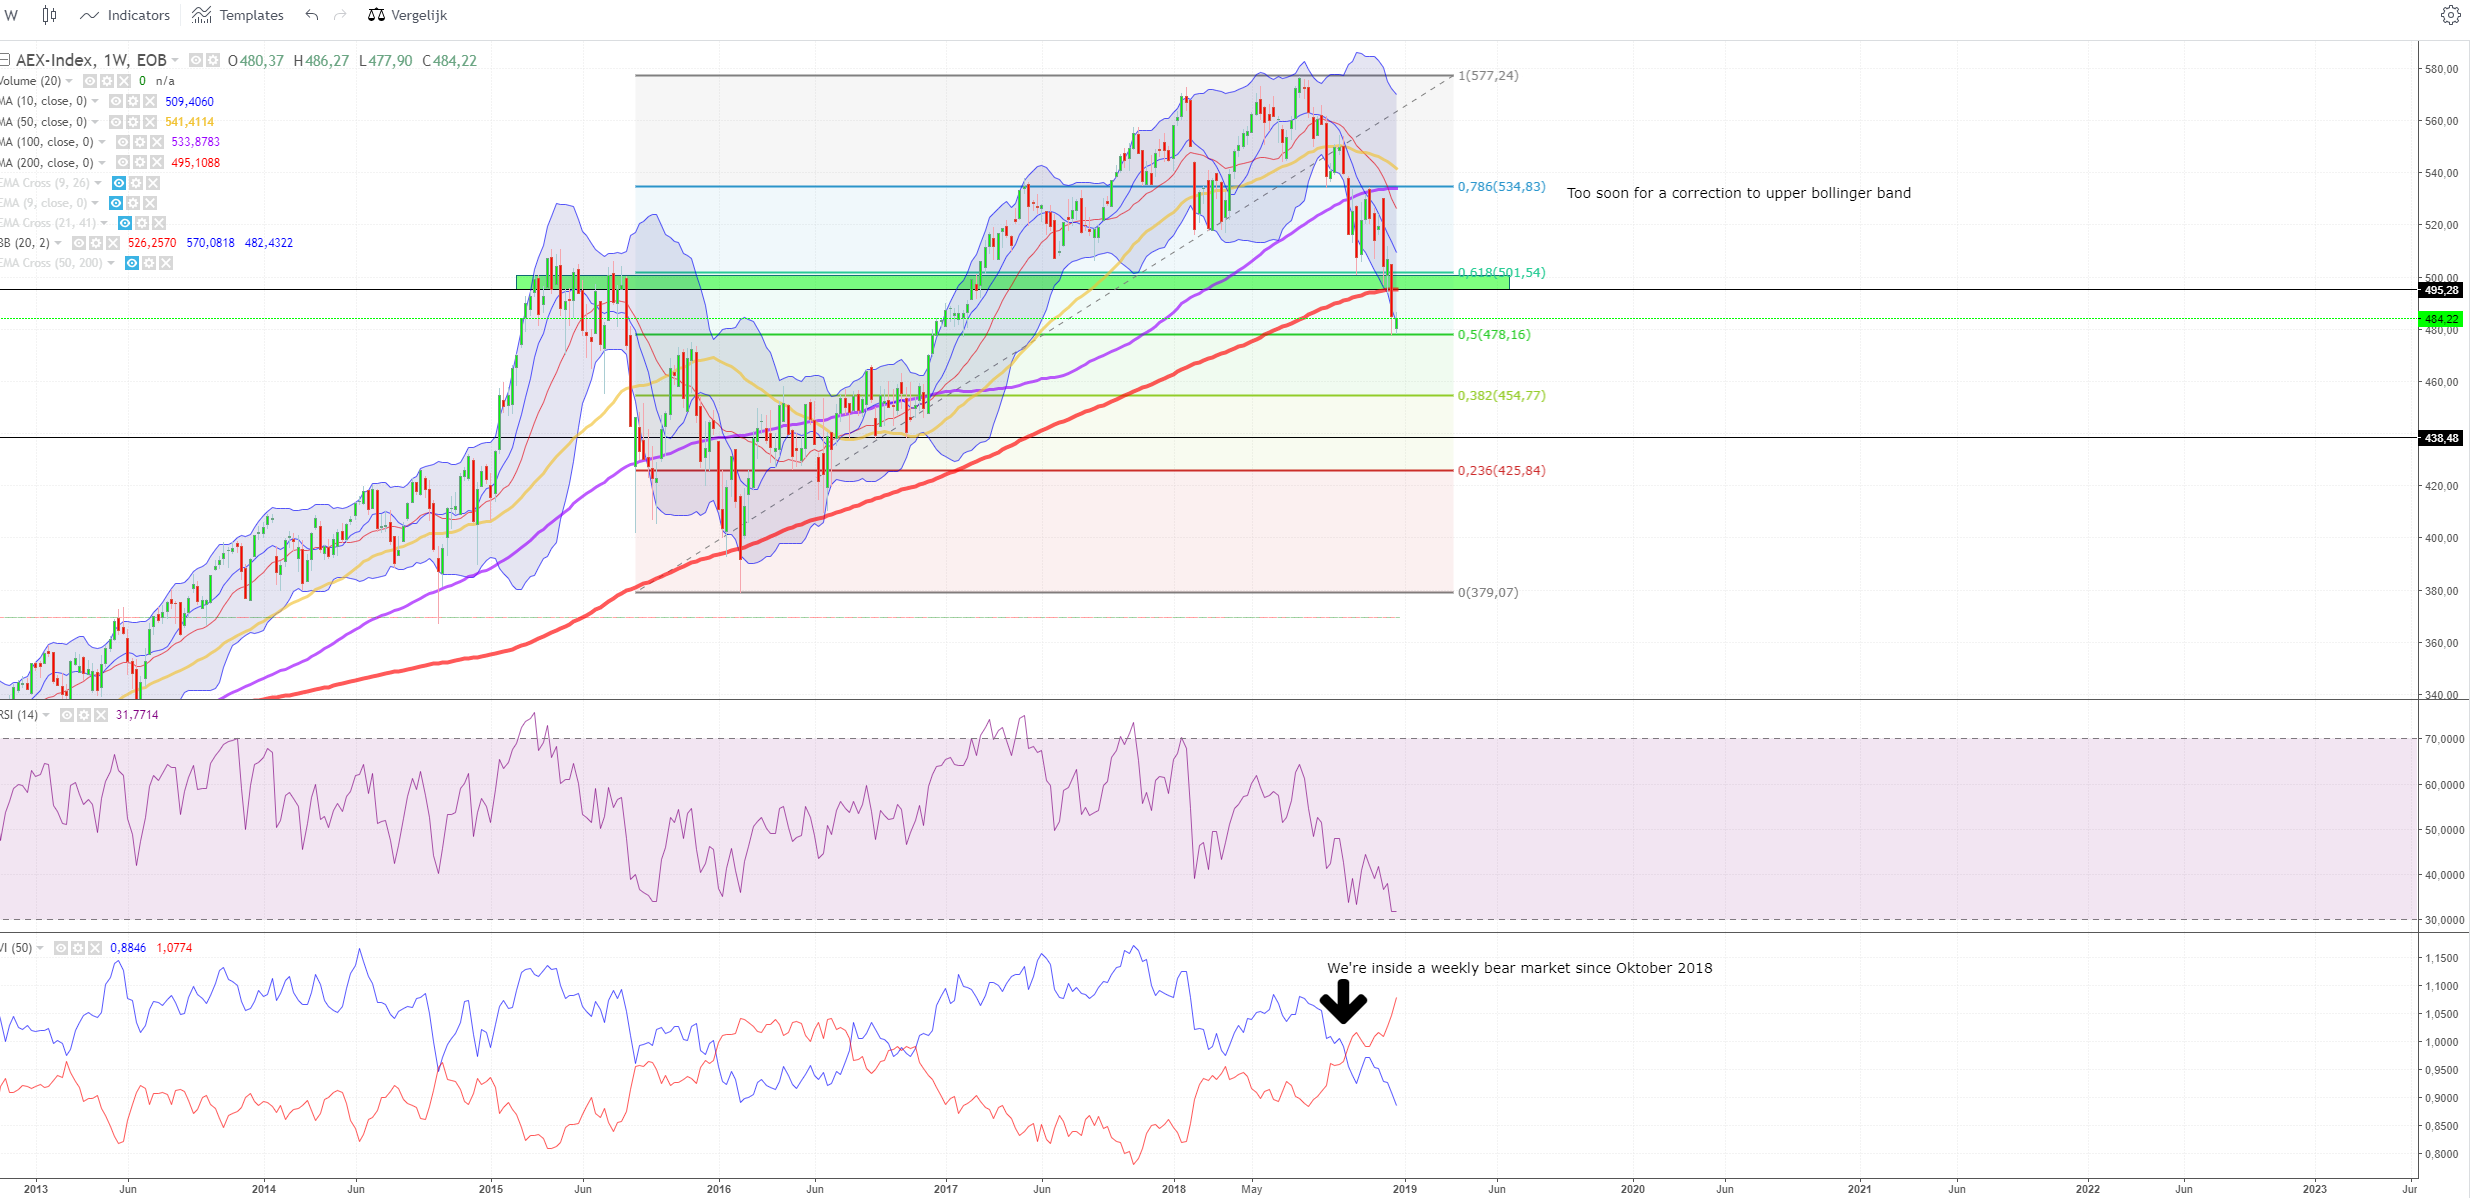
We're inside a bear market since October this was very obvious.
It seems a bit to early for a correction.
Corrections can go to upside of the bollinger, but for now, that's too high.
ma200 op week is now resistance not even support. I think atmost we could hit that around ~495, but is seems a bit too high. More likely to enter the ~450 area (very roughly) There was a lot of ups and downs inside that area in 2016.
I also have to mentiod that previous years we saw a January Rally. So be carefull with these.
Daily chart
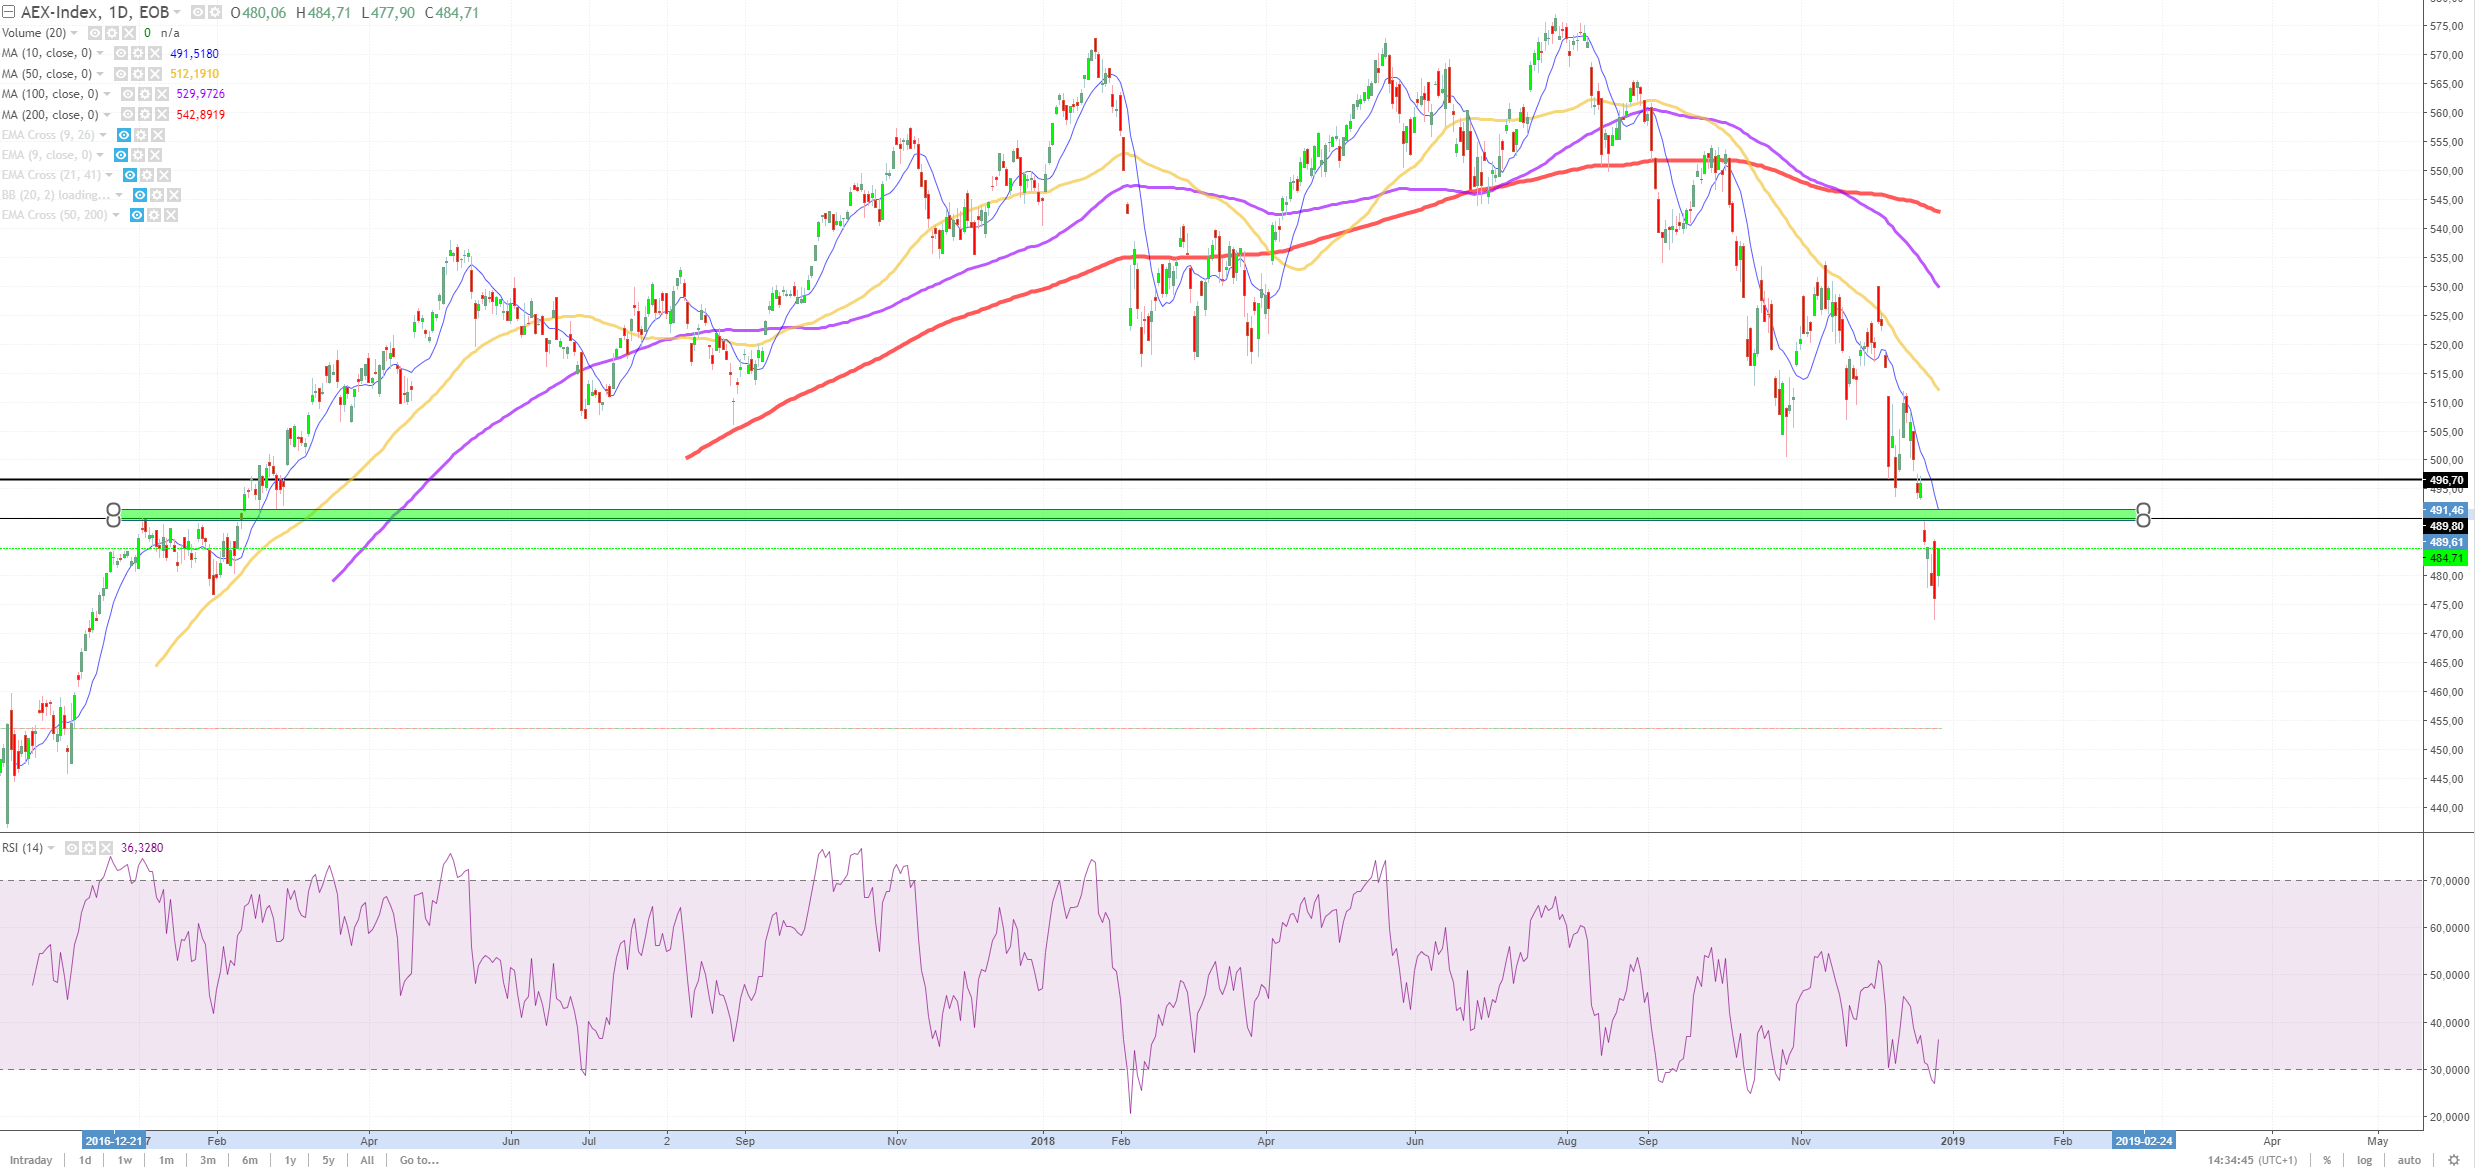
On day, the most likely up will be around 490-492 to hit the ma10. But this could take a couple of days, lowering the ma10's value.
1 Hour
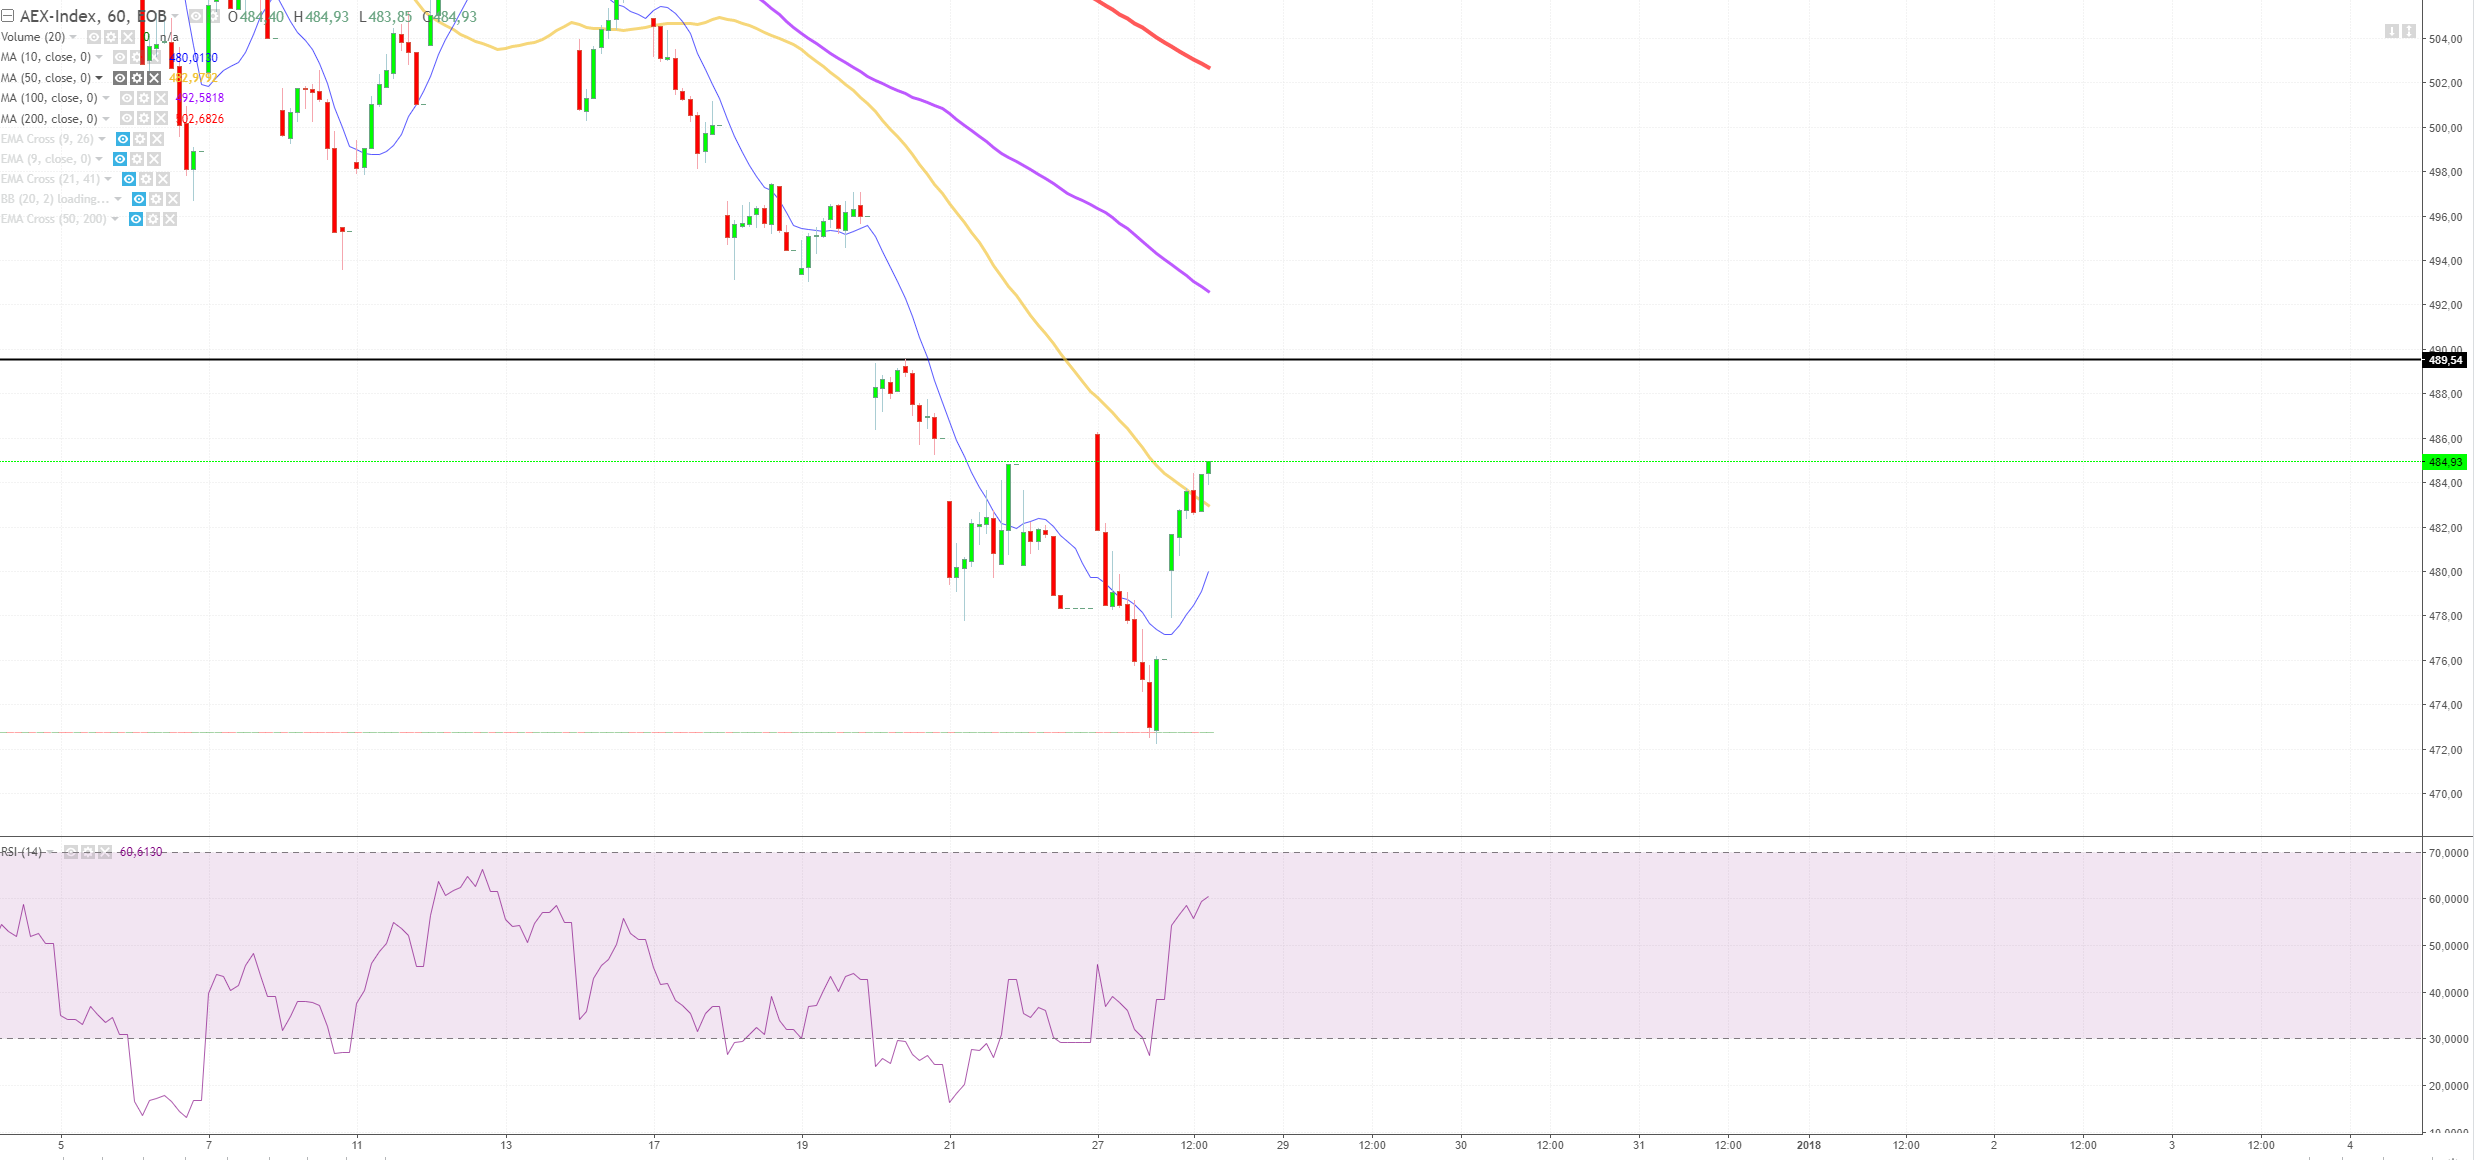
Remember the dailt ma10 on 291.5 it is decreasing around ~2 points a day. So tomorrow it will be around *289.5 * So there is a good possibility that the AEX will go up till 489,5 there is also a gap on 486 which could be filled, so be carefull in that area!