$AAPL struggling, what's next?
$AAPL is set to report earnings Feb 1, 2018.
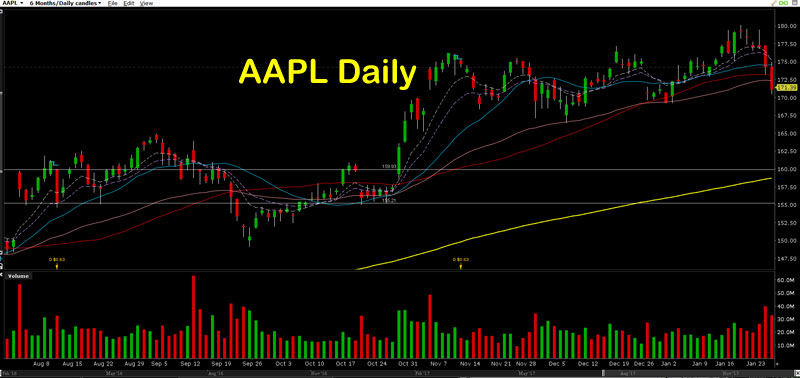
Reported from JPM lackluster iPhone X sales has caused the current sell off which began on 1/23/18 when the news was released at approx 2pm EST.
Interesting with this sell off is a lack of a bounce 3 days into the sell off.
The dip buyers are showing up each day and the stock keeps getting hammered lower.
Rarely the sellers ease of the gas and let it come back a little to keep selling.
Now, the selling on 1/23 and 1/24 and early 1/25 was quite violent and aggressive at times.
On 1/25 the selloff continued lower but felt like the major seller stepped out early on 1/25 as the selling action became less aggressive.
On 1/25 AAPL closed near the lows, still holding $170 and moving up slightly after hours.
Support exits right under $170.
Apple earnings will be out Feb 1st, 2018 and should help confirm the news or put it to rest.
However, more important I believe is the current up and down movement in the $170 zone over the last 3 months since early Nov, 2017. Since that time AAPL has moved in the $170 with stability in the lower $170s and strong support right under $170 and selling and weakness from $175-$180+. Some, especially in hindsight after a move higher, will call this consolidation. I am leaning toward this being topping action. I have watched AAPL form tops and bottoms numerous times and this is the behavior that it exhibits.

Everyone is looking for AAPL to have a $1 Trillion market cap with a share price of roughly $196.50.
Now look at the news itself causing the selloff. It's coming from JPM. With earnings due up next week, this selloff presents an opportunity to load up some shares for anyone who might have inside knowledge of (good) AAPL earnings.
If earnings causes a sharp move up, say toward the upper $180s and then pushing higher in the following days/weeks, everyone will be looking at the $1 Trillion mark. Once that is hit, it will be the $200 mark.
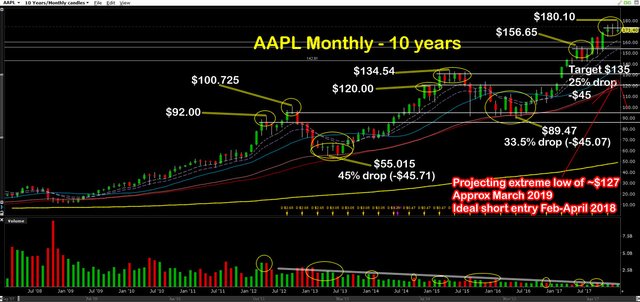
AAPL's history it likes key levels, pushes slightly thru them, and then fails quite substantially. The million dollar question is, what is that key level this time around. In the recent past it has been $100, $120, $135. Now is it $180, $195, $200, $220? We won't know until we know.
One thing is observable and that is AAPL tends to persist around the $3.50 level in every set of $10. So $93.50, $103.50, $143.50, $173.50, etc.
Also, don't forget about the earnings gap from last year FEB, 2017, $122-$127.... still waiting to be filled.
Since I don't have any interesting in speculating on AAPL's direction after earnings, I have to say this. If it is down sharply, I will look for continuation downward, and if it is up big, I will see this selloff as the con that I think it might be so JPM and friends can load up into earnings.
My preferred earnings action would be little reaction. I would like to see one more small push over $180 or high $170s and fail. From there I would consider this area to be a top be buying puts. The numbers work for me here. I want to see a pullback to $135 and that pullback should also be about 25%. That magic number puts the top at $180. The problem with this, is it lets down all the $1 Trillion market cap buyers and holders. On the other hand, it works for the Dow which needs to retest 20,000. That evil number projecting the Dow Jones high is oddly 26,666.
Calling this a top area conflicts with my personal belief that we will see about SPY $340 before all is said and done and based on the action, I don't want the next move down to be anything more than a 3-5% pullback quickly followed by buying resurgence and much higher highs.
No worries or need to predict the future, but it is imperative to be ready for it and recognize what is happening as it begins to happen. That is the time I will take action because that is the time that provides a defined level of risk. Until then, my guess is as good as my dog's.
My last note, is AAPL's monthly chart which is displaying topping action as well. Please see the graphic below.

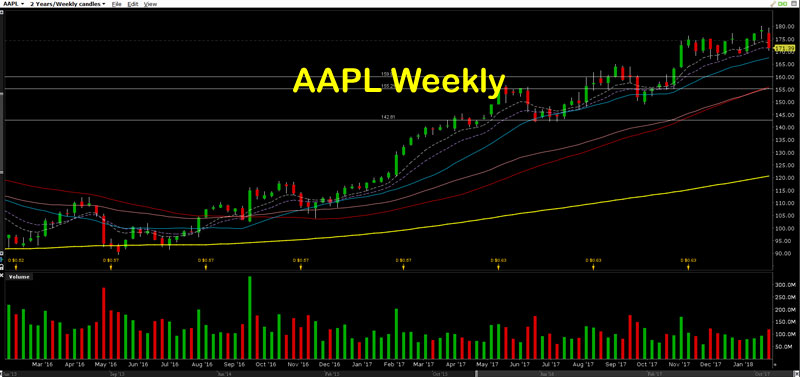
The weekly chart is also worth noting.

Legal Disclaimer:
This is my opinion only.
This is for entertainment purposes only.
This is NOT financial advice nor a recommendation to buy or sell anything.