Steem Price Analysis | 07 March, 2025
.png)
This is my latest version of the Steem Price Analysis series, those who continuously follow me, they're aware of this one. So, let's get started:
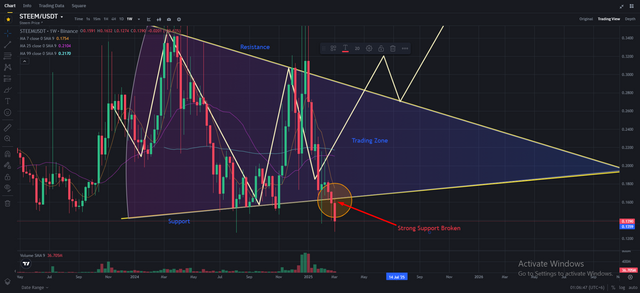
In this chart is the STEEM/USDT trading pair with a weekly timeframe. The chart depicts a big symmetrical triangle pattern, a common structure that signals potential breakout movements. The price action is seen consolidating within this triangle, gradually forming lower highs and higher lows, which reflects tightening volatility.
One of the interesting observations in this chart is the recent breakdown below a solid support level. This support, having broken up a number of times in the past, has now been broken, as indicated by the red arrow and tag. A break of such a key level tends to be a bearish continuation unless the price quickly recovers it. This break of support might well result in further downwards movement, with market participants probably looking for the next area of demand. But if the price is able to bounce back and return inside the triangle, it can again enter the consolidation stage.
The moving averages (MA 7, MA 25, and MA 99) provide additional details. The short-term moving averages are moving beneath the long-term MA, which is generally a bearish indicator. The MA 7 and MA 25 are currently situated below the price action, meaning potential resistance on any increase. If the price fails to break above these moving averages, the bearish trend will prevail.
The lower volume profile on the chart indicates heavy action at the breakdown point, and that's an indication of heavy selling pressure. This type of volume spike in support breaks is generally regarded as confirmation of the move in the same direction. But without follow-through on the breakdown, then a false breakout scenario may develop and cause the reversal back to the resistance of the triangle.
For traders and investors, the levels to watch are the former support, which is now resistance, and the following potential support area below the breakdown. A confirmed breakdown could lead to lower price targets, whereas a re-entry into the triangle could maintain the existing consolidation pattern. The direction of the long-term breakout will determine the following major trend for STEEM/USDT.
VOTE @bangla.witness as witness

OR

Thanks
