Moving Charts: STEEM Prices Analysis | 10% To @tron-fan-club
Hello and good evening to everyone at the Tron fan club. The market has rather on a stall for the past few weeks. We have seen most tokens fluctuate. Steem can be seen as one of them. Today we will see steem price movements and reflect on how it has fared.

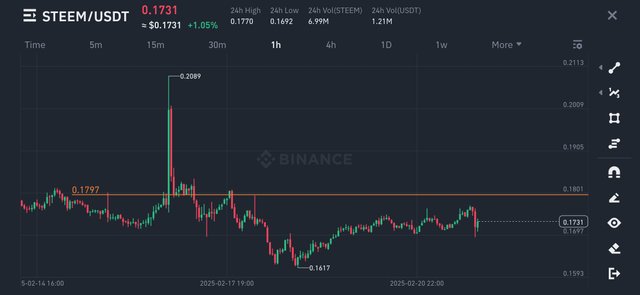
The week started with Steem gradually rising towards the resistance level of 0.18$. At the second try, Steem broke through the level and up to 0.209$. But alas! It was a fake-out actually. So it came back to the same level soon. Steem started going down losing strength.
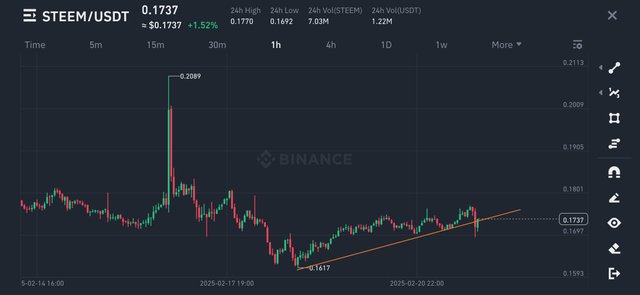
After making double bottom at the level of 0.162$, Steem again started its upward journey. This 0.162$ zone is now a crucial support for it. Steem needs to break through the strong resistance zone, with a successful retest. There will be 0.2$ zone ahead of Steem after that. As there is a bullish trendline below Steem now, it needs to hold onto that also.
All Screenshots are taken from Coingecko
After experiencing a few good weeks, Steem is currently showing mixed performance. It is down 6.3% in a week, which is very unfortunate.
No word from this article should be taken as financial advice.
Thank You.
VOTE @bangla.witness as witness

OR

Moving Charts: STEEM Prices Analysis is a great content you have shared.