Moving Charts: BTC Value Per Coin Analysis | 10% To @tron-fan-club
Hello everyone and welcome to everyone at Tron Fan Club. After creating a new all-time high in January 2025, Bitcoin has been consolidating for a long time. Hence, we witnessed downtrend in the last months with some exceptions. Today we will look at the price movements of BTC and reflect on where it could go next.

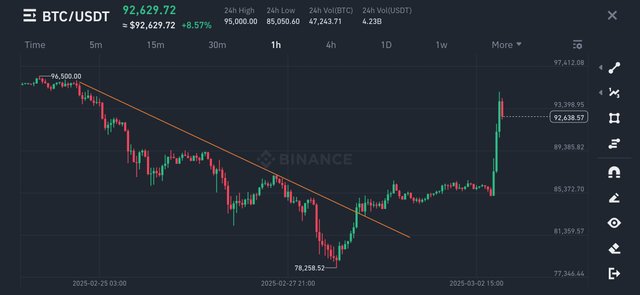
Last week, the King of Cryptocurrencies, BTC was hovering above the 95700$ level. BTC was on downtrend for weeks. At the start of the week, BTC started going downwards continuing its trend. But in the middle of the week, it reversed its movement and started going upwards. The bearish momentum was beaten when BTC crossed tge bearish trendline. Due the breakout, BTC went up to the sub 95000$ level, which was clearly a resistance zone.
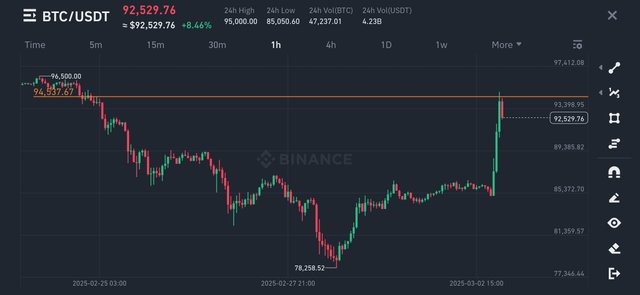
After the quick bounce movement, BTC went up to the level of 94500$. It is now fluctuating a lot. BTC is now below 93000$. It seems like a cup & handle pattern is being made. But to prove that, it needs to break through the resistance ahead at 94500$. This is ultimately a 3% lose in value over a time span of seven days.
All Screenshots are taken from Coingecko
No words from this article should be taken as financial advice.
Thank You for reading.
VOTE @bangla.witness as witness

OR

https://x.com/Arsalaan00070/status/1896274724558459011?t=B5kbJUtg8PzwfXZe0Q7axQ&s=19
It is a great article of Moving Charts: BTC Value Per Coin Analysis.